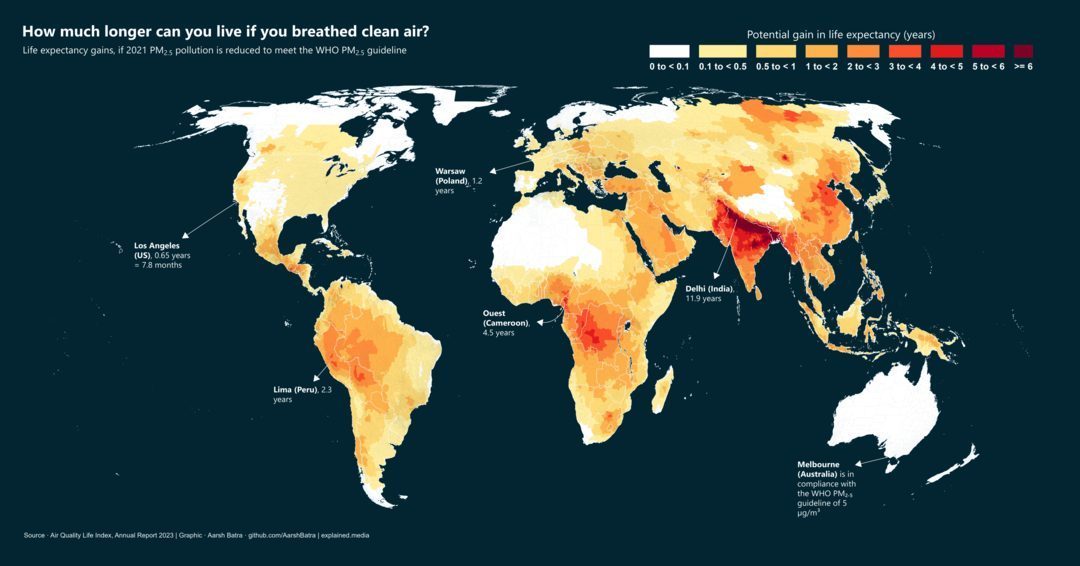
Air pollution, particularly from particulate matter with a width of 2.5 micrometers (PM2.5), poses significant health risks, including strokes, heart attacks, and increased risk of lung disease. The potential impacts are staggering: if global PM2.5 pollution levels in 2021 had met the World Health Organization (WHO) guidelines, the average life expectancy worldwide would have increased by more than two years. This stark reality is illustrated in an infographic by Aarsh Batra, which maps the potential life expectancy gains if everyone around the world breathed cleaner air.
Context / Why this matters
Understanding the link between air quality and life expectancy is crucial. PM2.5 particles are particularly hazardous because they can penetrate deep into the lungs and even enter the bloodstream, causing serious health issues. The WHO guideline for PM2.5 concentrations is 5 μg/m³, a benchmark that many cities worldwide struggle to meet. By visualizing the potential gains in life expectancy if this guideline were achieved, we gain a clearer picture of the urgency and importance of addressing air pollution.
Main discussion
Global Impact of Air Pollution
The infographic highlights that the impact of air pollution on life expectancy varies significantly across different regions. Some areas stand to gain more years of life expectancy than others, highlighting the uneven distribution of air pollution effects. For instance, Delhi, India, shows the highest potential gain with 11.9 years, while Los Angeles, USA, only gains 0.65 months. The stark contrast illustrates how different regions are affected by pollution and underscores the need for tailored interventions.
Key Cities and Their Gains
Several cities are prominently featured in the infographic, each with significant life expectancy gains if pollution levels were reduced:
- Warsaw (Poland): Potential gain of 1.2 years.
- Los Angeles (USA): Potential gain of 0.65 months. Although modest, this still represents significant health benefits for the population.
- Delhi (India): Dramatic potential gain of 11.9 years, illustrating the severe impact of air pollution in this region.
- Ouist (Cameroon): Potential gain of 4.5 years, reflecting the broader health risks in many African cities.
- Lima (Peru): Potential gain of 2.3 years, indicating the significant challenges faced by cities in South America.
Compliance and Progress
Melbourne, Australia, is highlighted as a city that currently complies with the WHO guideline of 5 μg/m³. This serves as a positive example for other cities aiming to improve their air quality. Melbourne's success underscores that achieving cleaner air is possible with concerted efforts and effective policies.
The Role of Data Visualization
Data visualization plays a critical role in making complex information accessible and understandable. By mapping life expectancy gains, the infographic provides a clear and compelling argument for the need to address air pollution. It allows viewers to grasp the magnitude of the issue quickly and understand the potential benefits of reducing pollution levels.
Practical tips
Understanding PM2.5 Levels
To better understand and address air pollution, it's essential to know the PM2.5 levels in your area. Many cities have air quality monitoring systems that provide real-time data. Familiarize yourself with these sources to stay informed about the air quality in your region.
Advocating for Cleaner Air
Engage with local policymakers and community organizations to advocate for cleaner air initiatives. Support policies that promote renewable energy, public transportation, and other measures to reduce pollution. Your voice can make a difference in pushing for better air quality standards.
Personal Protective Measures
While systemic change is essential, there are also personal measures you can take to protect yourself from air pollution. Consider using air purifiers in your home, wearing masks in high-pollution areas, and avoiding outdoor activities during peak pollution hours.
Important takeaways
The impact of air pollution on life expectancy is profound and affects people worldwide. By visualizing the potential gains in life expectancy if PM2.5 pollution levels were reduced to meet WHO guidelines, we can better understand the urgency of addressing this issue. Cities like Delhi and Ouist have substantial life expectancy gains, while others like Melbourne demonstrate that compliance with guidelines is achievable. Data visualization is a powerful tool for raising awareness and driving action. By staying informed, advocating for change, and taking personal protective measures, we can work towards a healthier future for all.
Conclusion
Air pollution has a direct and measurable impact on our health and life expectancy. The potential gains in life expectancy if PM2.5 pollution levels were reduced to meet WHO guidelines are staggering. By understanding the global impact, focusing on key cities, and taking practical steps, we can all play a part in improving air quality. The infographic provides a compelling visual representation of the issue, underscoring the need for action and the potential benefits of a cleaner world.
Watch the Reel
Questions readers ask
What are the primary health risks associated with PM2.5 air pollution?
PM2.5 pollution, which consists of particles with a width of 2.5 micrometers, can penetrate deep into the lungs and even enter the bloodstream. This exposure increases the risk of severe health issues such as strokes, heart attacks, and lung diseases. The smaller the particle, the more hazardous it can be.
How much would life expectancy increase if global PM2.5 pollution met WHO guidelines?
If PM2.5 pollution levels worldwide had met the World Health Organization (WHO) guidelines in 2021, the average global life expectancy would have increased by more than two years. This significant gain underscores the critical importance of cleaner air for public health.
Which cities would benefit most from reduced PM2.5 pollution?
Cities with high levels of air pollution, such as Delhi, would see substantial benefits. Delhi, for instance, could gain nearly 12 years in average life expectancy if PM2.5 pollution were reduced to WHO guidelines. Other highly polluted cities, like Los Angeles, would also experience notable increases in life expectancy.
What are the specific benefits of cleaner air for public health?
Cleaner air significantly reduces the risk of respiratory and cardiovascular diseases. By lowering exposure to PM2.5 pollution, people can experience a decrease in the incidence of strokes, heart attacks, and lung diseases, leading to a healthier population overall.
How does PM2.5 pollution affect life expectancy differently across regions?
The impact of PM2.5 pollution on life expectancy varies by region based on the current pollution levels. Areas with higher pollution, such as many urban centers in developing countries, stand to gain the most in terms of increased life expectancy if air quality improvements are achieved.
What steps can individuals take to mitigate the effects of PM2.5 pollution?
While systemic changes are crucial, individuals can take steps to reduce their exposure to PM2.5 pollution. Wearing face masks, especially in high-pollution areas, using air purifiers at home, and staying informed about local air quality indexes can help minimize the health risks associated with PM2.5.
Why is it important to adhere to WHO air quality guidelines for PM2.5?
The WHO guidelines for PM2.5 are set to protect public health by ensuring that air pollution levels are kept within safe limits. Adhering to these guidelines can prevent millions of premature deaths and significantly improve the quality of life for people worldwide by reducing the health risks associated with air pollution.
Related deep dives
Similar reads based on topic and creator.



Recent articles
Fresh deep dives from the latest Reels we unpacked.




Comments
Be the first to comment.