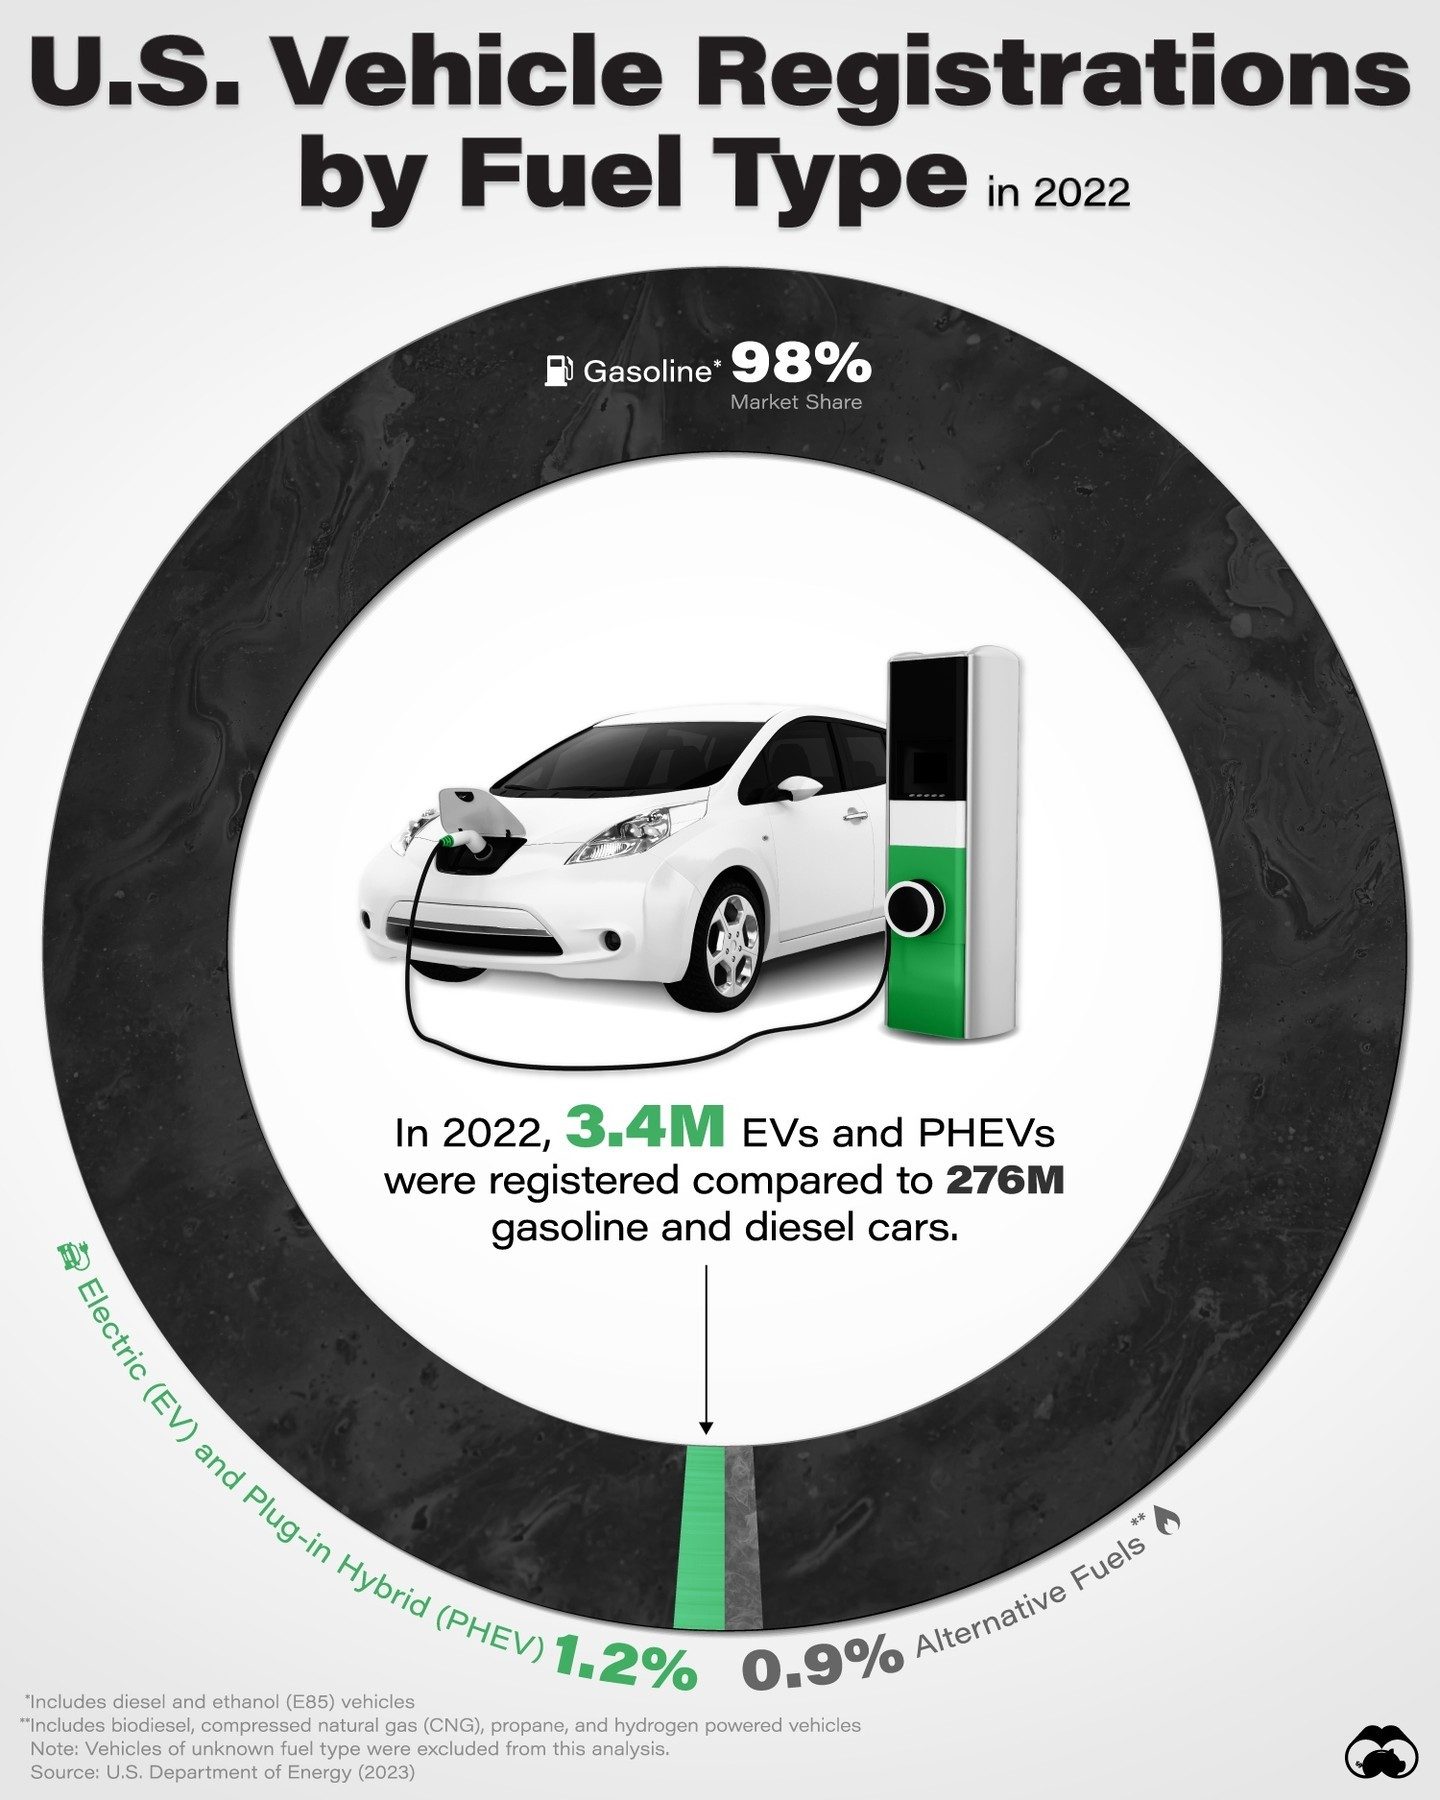
Vehicle Registrations by Fuel Type in the U.S.
Electric vehicles (EVs) and plug-in hybrids (PHEVs) are increasingly visible on U.S. roads, but how much of the market have they actually captured from traditional gasoline-powered cars? Recent data from the U.S. Department of Energy reveals that the impact, while growing, is still relatively small.
In 2022, out of the 281 million light-duty vehicles registered in the U.S., only 1.2% were electric or plug-in hybrid vehicles. This means that 3.4 million EVs and PHEVs were registered compared to 276 million gasoline and diesel cars. Gasoline vehicles continue to dominate, accounting for 98% of all vehicle registrations. Alternative fuels make up the remaining 0.9%.
Why This Matters
Understanding the distribution of vehicle registrations by fuel type is crucial for several reasons. It provides insight into consumer preferences, the effectiveness of environmental policies, and the future of the automotive industry. As governments and manufacturers push for more sustainable transportation, tracking the adoption of EVs and PHEVs helps gauge progress and identify areas for improvement.
Main Discussion
Gasoline Vehicle Dominance
The overwhelming majority of vehicles on the road are gasoline-powered. This dominance is a result of historical infrastructure, consumer familiarity, and the relatively lower upfront cost of traditional vehicles. However, the environmental impact of gasoline vehicles is a significant concern, driving the push for more sustainable alternatives.
Electric and Plug-in Hybrid Vehicle Adoption
Electric vehicles and plug-in hybrids are gaining traction, but they still represent a small fraction of the overall market. The 1.2% market share for EVs and PHEVs in 2022 indicates steady growth, but also highlights the challenges in transitioning to a more electrified fleet. Factors such as charging infrastructure, battery technology, and vehicle cost play significant roles in the adoption rate.
State-by-State EV Adoption
The adoption of electric vehicles varies widely across the U.S. Some states have embraced EVs more quickly than others. For example, in 2022, the top five states by EV adoption were:
- District of Columbia (DC): 3.5%
- Hawaii: 2.9%
- Washington: 2.4%
- Oregon: 2.4%
- California: 2.0%
These states have implemented policies and incentives to encourage EV adoption, such as tax credits, rebates, and investments in charging infrastructure. Conversely, states with the lowest EV adoption rates include:
- Louisiana: 0.1%
- West Virginia: 0.2%
- Wyoming: 0.2%
- North Dakota: 0.2%
- Mississippi: 0.2%
These states lag behind in EV adoption, which can be attributed to a variety of factors including lower environmental awareness, less supportive policies, and fewer incentives for EV purchases.
Practical Tips
For those considering the switch to an electric vehicle, there are several practical steps to take:
Assess Charging Needs
Before purchasing an EV, evaluate your daily driving habits and charging needs. If you have access to a garage or dedicated parking spot, installing a home charging station can be convenient. Additionally, consider the availability of public charging stations in your area.
Research Incentives and Rebates
Many states and local governments offer incentives for purchasing an EV, such as tax credits, rebates, and reduced registration fees. Research available programs in your area to offset the higher upfront cost of an EV.
Consider Total Cost of Ownership
While EVs often have a higher initial cost, the total cost of ownership can be lower over time due to reduced fuel and maintenance expenses. Factor in savings on gasoline, oil changes, and other routine maintenance when evaluating the overall cost of an EV.
Important Takeaways
Slow but Steady Growth
The market share of electric and plug-in hybrid vehicles is growing, albeit slowly. The 1.2% market share in 2022 indicates a rising trend but also underscores the need for continued efforts to accelerate adoption.
Regional Disparities
EV adoption varies significantly by state, highlighting the importance of local policies and infrastructure. States with higher adoption rates have implemented supportive policies and built robust charging networks, while those with lower rates may need more aggressive initiatives to catch up.
Policy and Incentives Matter
Government policies and consumer incentives play a critical role in driving EV adoption. Tax credits, rebates, and investments in charging infrastructure can make EVs more accessible and attractive to consumers.
Future Outlook
As technology advances and more consumers become aware of the benefits of EVs, the market share is expected to grow. However, achieving significant market penetration will require coordinated efforts from policymakers, manufacturers, and consumers.
Conclusion
Electric and plug-in hybrid vehicles are slowly gaining ground in the U.S. market, but they still represent a small fraction of total vehicle registrations. Understanding the current landscape and the factors driving EV adoption is crucial for stakeholders at all levels. By addressing infrastructure challenges, promoting supportive policies, and encouraging consumer awareness, the transition to a more sustainable fleet can be accelerated.
Watch the Reel
Questions readers ask
What was the percentage of electric and plug-in hybrid vehicles in the U.S. in 2022?
In 2022, electric and plug-in hybrid vehicles made up 1.2% of the total 281 million light-duty vehicles in the U.S. This percentage shows a growth trend, but electric vehicles still have a long way to go to gain a larger share of the market.
How many electric and plug-in hybrid vehicles were registered in the U.S. in 2022?
During 2022, 3.4 million electric and plug-in hybrid vehicles were registered in the U.S. This figure shows the growing popularity of these vehicles.
What percentage of vehicle registrations were gasoline vehicles?
Gasoline vehicles accounted for 98% of all vehicle registrations in the U.S. during 2022. This dominance shows the vast gap between gasoline vehicles and electric vehicles.
What was the ratio of electric vehicles to gasoline vehicles in the U.S. in 2022?
The ratio of electric vehicles to gasoline vehicles in the U.S. in 2022 was approximately 1:80. This shows the significant gap between the number of electric and gasoline vehicles.
How many vehicles make up the alternative fuels category in the U.S. in 2022?
Alternative fuel vehicles, including electric and plug-in hybrid vehicles, made up 0.9% of all vehicle registrations in 2022, equating to 2.5 million vehicles. This figure shows the popularity of alternative fuel vehicles.
What is the total number of light-duty vehicles registered in the U.S. in 2022?
In 2022, there were 281 million light-duty vehicles registered in the U.S. This figure includes gasoline, diesel, electric, and plug-in hybrid vehicles.
Why is the distribution of vehicle registrations important?
The distribution of vehicle registrations helps track the progress towards more sustainable transportation. It provides insights into the adoption rates of electric and plug-in hybrid vehicles and the continued dominance of gasoline vehicles.
Related deep dives
Similar reads based on topic and creator.


Recent articles
Fresh deep dives from the latest Reels we unpacked.




Comments
Be the first to comment.