CO2 Emissions by Country
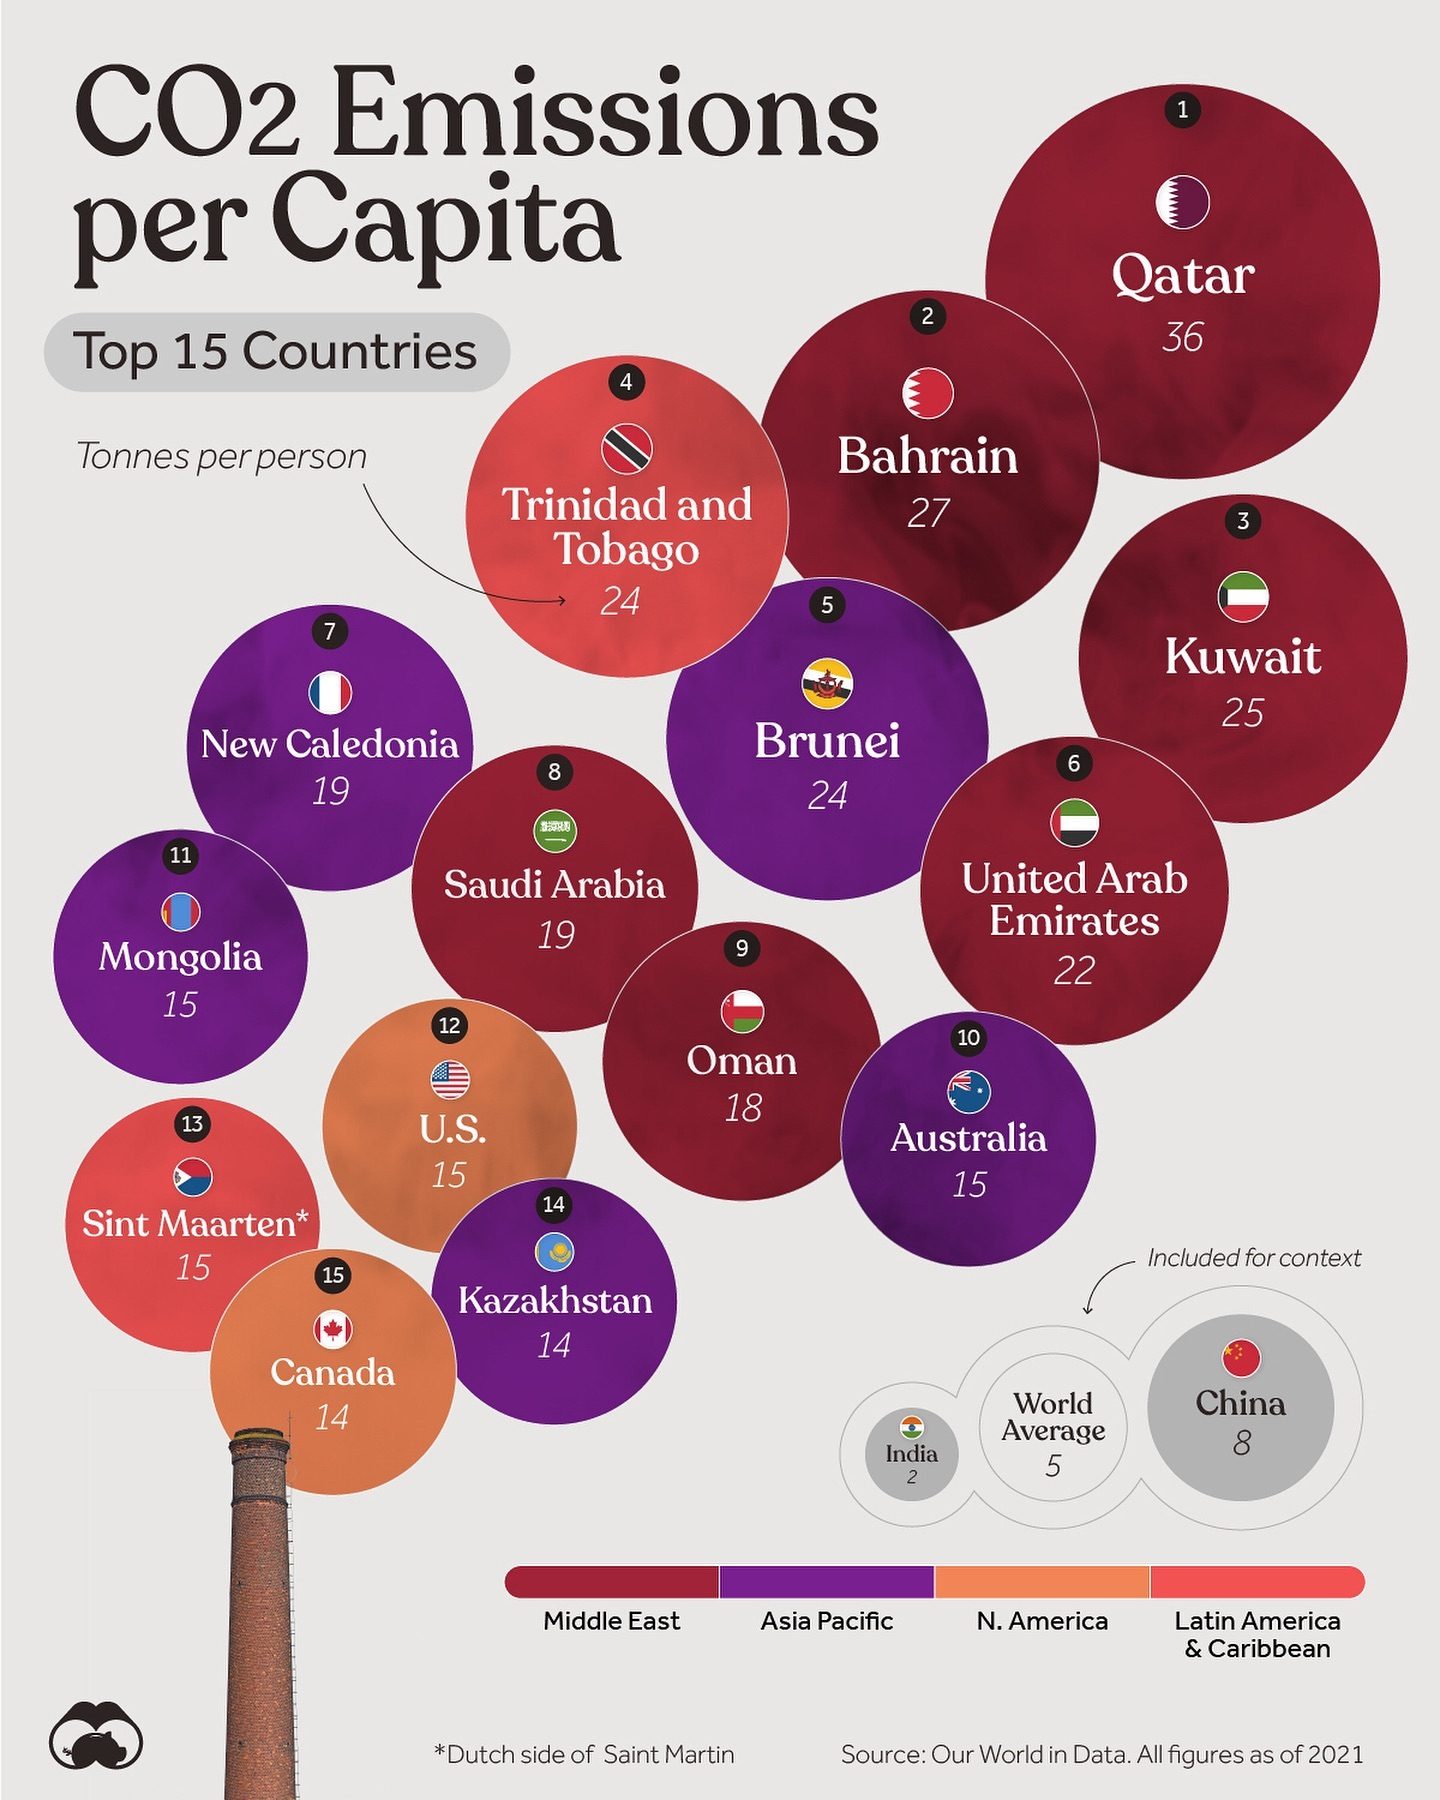
There is a significant difference in carbon emissions when viewed through the lens of the world's largest economies versus per capita emissions. To gain a more nuanced understanding, it is essential to examine the top 15 countries with the highest per capita carbon emissions. This analysis uses data from 2021, sourced from Our World in Data.
Context / Why This Matters
Carbon emissions are a critical factor in global climate change. Understanding which countries emit the most carbon per person can provide insights into consumption patterns, energy use, and industrial activities. This information is valuable for policymakers, environmentalists, and anyone interested in sustainability.
Main Discussion
Top 15 Countries with the Highest CO2 Emissions Per Capita
The Leaders
The top emitters, measured in tonnes of CO₂ per person, reveal some surprising results. Leading the list is Qatar, with an astonishing 36 tonnes of CO₂ emissions per capita. This is more than six times the global average. Qatar's high emissions can be attributed to its extensive natural gas production and energy-intensive industries.
Bahrain follows closely with 27 tonnes per capita, while Kuwait and Brunei both emit around 25 tonnes. These countries are significant oil producers and exporters, which contributes to their high per capita emissions. Trinidad and Tobago, with 24 tonnes, is another major oil and gas producer.
The Middle Ground
Further down the list, countries like Saudi Arabia, the United Arab Emirates, and New Caledonia emit around 19-22 tonnes of CO₂ per person. These nations are also heavily reliant on fossil fuel exports, which drives up their emissions.
The Rest of the Top 15
The rest of the top 15 includes Mongolia, Australia, the United States, Sint Maarten, Kazakhstan, and Canada. These countries emit between 14 and 15 tonnes of CO₂ per person. While these figures are lower than those at the top, they are still considerably higher than the global average of 5 tonnes per person.
Comparative Analysis
Comparing these figures to the world average and regional averages provides further context. For instance, Latin America and the Caribbean have an average of 2.4 tonnes per person, while the Asia Pacific region emits around 4.5 tonnes. North America, which includes the United States and Canada, has an average of 15.2 tonnes per person. The Middle East, with its significant oil and gas production, has an average of 12.8 tonnes per person.
Practical Tips
Understanding Your Footprint
To reduce your carbon footprint, consider the following tips:
- Energy Efficiency: Invest in energy-efficient appliances and lighting. This can significantly reduce your electricity consumption and, consequently, your carbon emissions.
- Renewable Energy: If possible, switch to renewable energy sources like solar or wind power. Many countries now have programs that make this transition more accessible.
- Sustainable Transportation: Opt for public transportation, carpooling, biking, or walking instead of driving. If you must drive, consider an electric or hybrid vehicle.
- Dietary Choices: Reduce your consumption of meat and dairy products. Livestock farming is a significant contributor to greenhouse gas emissions.
- Waste Management: Recycle and compost as much as possible. Landfills produce methane, a potent greenhouse gas.
Policy and Advocacy
For a broader impact, advocacy and policy changes are crucial. Support policies that promote renewable energy, carbon pricing, and stricter emission standards. Encourage your government to invest in green technologies and infrastructure.
Important Takeaways
- Per Capita Emissions: Understanding per capita emissions provides a more accurate picture of a country's impact on the environment.
- Energy Use: Countries with high per capita emissions often rely heavily on fossil fuels for energy.
- Regional Differences: Emission levels vary significantly by region, with some areas emitting much more than others.
- Policy and Personal Actions: Both policy changes and individual actions are essential for reducing carbon emissions.
Conclusion
Examining the top 15 countries with the highest per capita CO₂ emissions offers valuable insights into global carbon footprints. While some countries lead the list due to their reliance on fossil fuels, others have significant room for improvement. By understanding these emissions and taking practical steps to reduce them, individuals and governments can work towards a more sustainable future.
Watch the Reel
Questions readers ask
Why do some fossil fuel-producing countries have high per capita CO₂ emissions?
Fossil fuel-producing countries often have high per capita CO₂ emissions due to their extensive extraction and processing activities. These processes release significant amounts of CO₂ into the atmosphere. Additionally, these countries often have energy-intensive industrial activities and high consumption patterns, which further contribute to their emissions.
What does it mean when a country has high per capita CO₂ emissions?
When a country has high per capita CO₂ emissions, it indicates that, on average, each person in that country is responsible for a significant amount of carbon emissions. This can be due to a variety of factors, including high energy consumption, heavy reliance on fossil fuels, and energy-intensive industries.
Is the United States one of the world's biggest CO₂ emitters on a per capita basis?
Yes, the United States is one of the world's biggest CO₂ emitters on a per capita basis. It is known for its significant energy consumption and extensive industrial activities, which contribute to its high emissions. The U.S. also has a high standard of living, which is often correlated with greater energy use and emissions.
How do I find the most current data on CO₂ emissions by country?
To find the most current data on CO₂ emissions by country, you can refer to reliable sources such as the Global Carbon Project, the International Energy Agency (IEA), or Our World in Data. The World Resources Institute also publishes an annual report called the Global Carbon Budget which has up to date emissions data. These organizations provide comprehensive and regularly updated information on CO₂ emissions, allowing for insightful analysis and comparison between countries.
What are the differences between total CO₂ emissions and per capita CO₂ emissions?
Total CO₂ emissions measure the overall amount of carbon dioxide released by a country, while per capita CO₂ emissions indicate the average amount of CO₂ released per person in a country. Total emissions can be heavily influenced by a country's population and size, whereas per capita emissions reflect individual consumption and lifestyle patterns, providing a more accurate picture of personal impact.
How can understanding per capita CO₂ emissions help in reducing global carbon emissions?
Understanding per capita CO₂ emissions can help identify countries and populations with high individual carbon footprints, enabling policymakers to target initiatives and policies for reducing emissions. This information can drive policy changes and consumer behavior, helping to achieve lower global carbon emissions. By pinpointing specific areas and lifestyles contributing to emissions, targeted strategies can be developed to minimize carbon footprints.
How can I compare the CO₂ emissions of different countries?
To compare the CO₂ emissions of different countries, you can use per capita emissions data, which allows you to assess the emissions per person. This comparison accounts for differences in population size and provides a more accurate picture of individual impact. For a comprehensive view, you can use data from sources like the Global Carbon Project, the International Energy Agency (IEA), or Our World in Data, which offer detailed emissions charts and datasets for various countries.
Related deep dives
Similar reads based on topic and creator.


Recent articles
Fresh deep dives from the latest Reels we unpacked.




Comments
Be the first to comment.