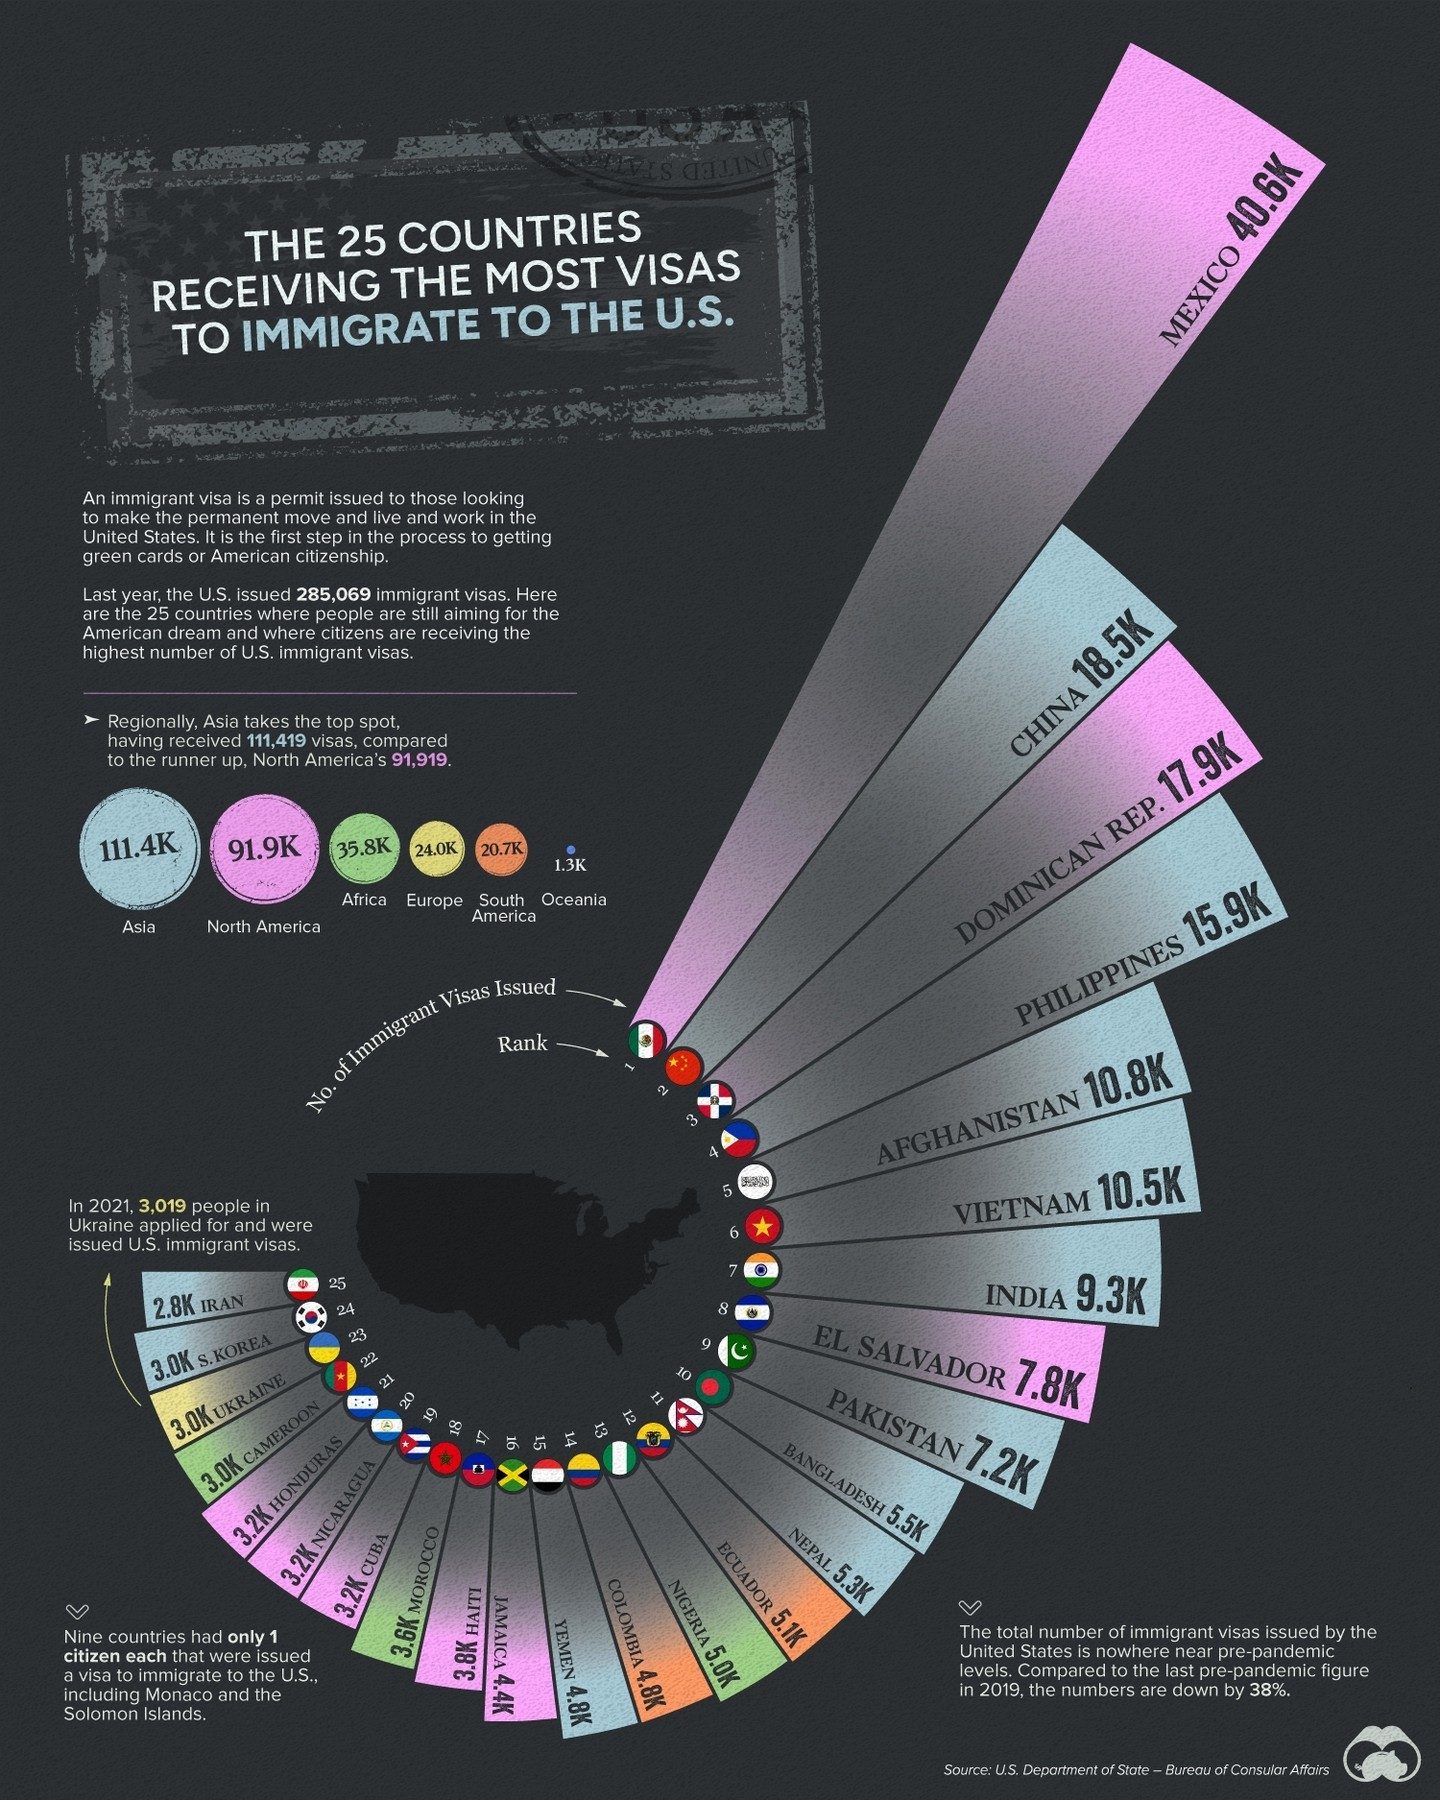
The 25 Countries Receiving the Most U.S. Immigrant Visas
U.S. immigration visa statistics reveal a compelling picture of global migration patterns, with a significant number of people aspiring to come to the United States for various opportunities. These statistics highlight the countries whose citizens receive the highest number of U.S. immigrant visas, offering insights into the geographic origins of new immigrants.
Why This Matters
Understanding which countries have the highest number of visa recipients can provide valuable context for policymakers, researchers, and anyone interested in global migration trends. This data is sourced from the U.S. Department of State - Bureau of Consular Affairs. It helps in analyzing the demographics of immigrants, the impact of immigration policies, and the broader socio-economic effects of migration.
Top 25 Countries Receiving the Most U.S. Immigrant Visas
Ukraine Leads the Way
Ukraine leads the list with 111.4K visas, reflecting the significant number of Ukrainians seeking opportunities in the United States. This could be attributed to various factors, including the ongoing conflict in the region, economic aspirations, and family reunification.
China and the Dominican Republic
China follows with 18.5K visas, indicating a substantial number of Chinese immigrants. The Dominican Republic, with 17.9K visas, is also a significant contributor, highlighting the strong ties and flows between the two countries.
Asian and Latin American Influence
The Philippines and Afghanistan are next with 15.9K and 10.8K visas, respectively. This underscores the significant migration from these countries, often driven by economic opportunities and family reunification.
Vietnam follows with 10.5K visas, reflecting a long-standing trend of Vietnamese immigration to the U.S. Similarly, El Salvador, India, and Pakistan are notable with 7.8K, 9.3K, and 7.2K visas, respectively. These countries are significant sources of immigrants, often motivated by economic opportunities and family ties.
Middle Eastern and African Countries
Yemen and Bangladesh each receive 4.8K visas, showing a notable presence of immigrants from these regions. Nicaraqua and Ecuador, with 5.1K and 5.3K visas, also show significant migration flows. Colombia and Morocco, with 4.0K and 3.8K visas, respectively, are notable sources of immigrants to the U.S.
Eastern European and Korean Immigration
Cambodia and Honduras, with 3.2K and 3.0K visas, respectively, highlight the presence of immigrants from these countries. Ukraine and Korea, with 2.8K and 3.0K visas, respectively, round out the top 25 countries, indicating ongoing migration trends from these regions.
Smaller Visa Recipients
Nine countries received only a small number of visas, indicating a lesser but still notable presence of immigrants from these regions.
Factors Influencing Visa Distribution
Economic Opportunities
Economic opportunities in the U.S. are a significant driving factor for immigrants from various countries. The promise of better job opportunities, higher wages, and improved living conditions attracts a large number of immigrants.
Family Reunification
Family reunification is another critical factor. Many immigrants come to the U.S. to reunite with family members who are already living in the country. This is a significant motivator for immigrants from countries like the Philippines, Vietnam, and El Salvador, where family ties are strong.
Conflict and Instability
Conflict and instability in home countries also play a significant role. Countries like Ukraine, Afghanistan, and Yemen have seen significant numbers of their citizens seeking visas due to ongoing conflicts and instability.
Analysis of Immigration Trends
Trends Over Time
The data shows that while some countries have consistently high numbers of visa recipients, there are also fluctuations in the numbers. For example, the numbers from Ukraine may have spiked due to recent events, while other countries may show a more stable trend.
Policy and Visa Allocations
The distribution of visas is also influenced by U.S. immigration policies and visa allocations. These policies can change over time, affecting the number of visas issued to different countries. For instance, changes in refugee policies or visa caps can impact the numbers significantly.
Conclusion
The distribution of U.S. immigrant visas among the top 25 countries provides a comprehensive view of global migration patterns. Understanding these patterns and the factors influencing them helps in formulating better policies and strategies for immigration. Whether driven by economic opportunities, family reunification, or conflict, the trend of immigration to the U.S. is a complex yet intriguing aspect of global migration.
Watch the Reel
Questions readers ask
Which country leads in the number of U.S. immigrant visas issued?
Ukraine currently leads in the number of U.S. immigrant visas issued, reflecting the significant impact of conflict and displacement on migration patterns. This trend highlights the humanitarian aspects of U.S. immigration policies, which prioritize those fleeing unstable or dangerous situations.
What are the most common reasons for immigrants from these countries to seek U.S. visas?
The primary reasons for immigrants from these countries to seek U.S. visas include family reunification, economic opportunities, and seeking refuge from conflict. These factors drive global migration to the USA, shaping the demographics of new immigrants and influencing U.S. immigration trends.
How can I find the most recent U.S. visa statistics by country?
The most recent U.S. visa statistics by country can be found on the U.S. Department of State - Bureau of Consular Affairs website. This data provides a comprehensive overview of the number of visas issued to each country and can help visualize global migration to the USA through a US visa infographic.
What is the U.S. visa application process for citizens of these countries?
The U.S. visa application process for citizens of these countries typically involves submitting an application, attending an interview at a U.S. embassy or consulate, and providing necessary documentation. The specifics can vary depending on the type of visa and the applicant's individual circumstances.
What trends can be observed in the global migration to the USA based on these statistics?
The global migration to the USA, as indicated by these statistics, shows a strong correlation with global events such as conflicts, economic instability, and family connections. This data can provide insights into how these factors influence U.S. immigration trends and the distribution of visas across different countries.
How do these visa statistics help in understanding global migration patterns?
These visa statistics offer valuable insights into global migration patterns by revealing the geographic origins of new immigrants. This information can be useful for understanding the impact of immigration on both the country and the USA, and for analyzing the demographics of the immigrants.
What should I know about the US visa for Ukraine citizens?
Information about the US visa for Ukraine citizens can be found on the U.S. Department of State - Bureau of Consular Affairs. Citizens are eligible for various visa types, including humanitarian visas, and the specifics of the application process may be influenced by the ongoing conflict in Ukraine.
Related deep dives
Similar reads based on topic and creator.




Recent articles
Fresh deep dives from the latest Reels we unpacked.




Comments
Be the first to comment.