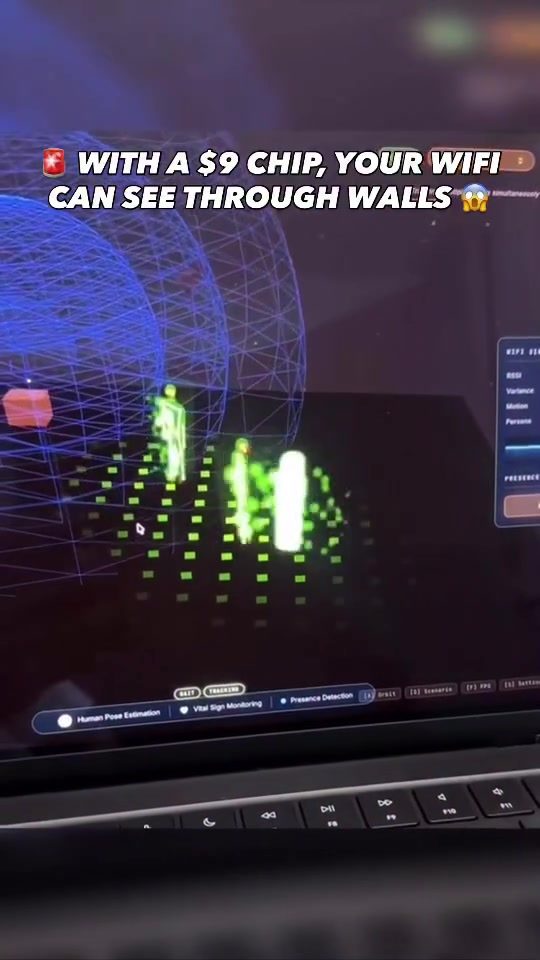
WiFi Signal Visualization: Understanding Penetration and Presence Detection
WiFi signal visualization is a powerful tool that enables users to better understand and optimize their wireless networks. By visualizing signal strength and penetration, users can identify dead zones, optimize router placement, and even monitor presence within a space.
Context: Why This Matters
In today's connected world, a stable and reliable WiFi signal is essential. Whether you're working from home, streaming content, or ensuring seamless connectivity for smart home devices, understanding how WiFi signals behave within your environment can significantly enhance your experience. This is where WiFi signal visualization software comes into play. By providing a clear visual representation of signal strength and penetration, this software helps users make informed decisions about their network setup.
What is WiFi Signal Visualization?
WiFi signal visualization software, like the one demonstrated, offers a 3D representation of WiFi signals as they penetrate through walls and other obstacles. This visualization is not just about seeing where your signal is strong or weak; it also includes metrics like Received Signal Strength Indicator (RSSI) and presence detection, which can be crucial for various applications, including 'Vital Sign Monitoring'.
The Role of RSSI and Presence Detection
RSSI (Received Signal Strength Indicator) is a metric that measures the power present in a received radio signal. In the context of WiFi, RSSI helps users understand the strength of the signal in different areas of their environment. A higher RSSI value indicates a stronger signal, while a lower value suggests a weaker signal.
Presence detection takes this a step further by not only measuring signal strength but also detecting the presence of devices or even people within the WiFi coverage area. This can be particularly useful in smart homes, offices, and other environments where monitoring movement and presence is important.
The $9 Chip: Enabling Wall-Penetrating WiFi
One of the most intriguing claims made in this demonstration is that a mere $9 chip can enable wall-penetrating WiFi capabilities. This chip is designed to enhance signal penetration, allowing WiFi signals to travel through walls more effectively. This is a game-changer for many users, as it can significantly reduce the number of dead zones in a building and improve overall connectivity.
Main Discussion
How Does WiFi Signal Visualization Work?
The software showcased uses advanced algorithms to map out the WiFi signals in a 3D space. This involves several steps:
- Signal Mapping: The software scans the environment and maps out the WiFi signals, taking into account various factors like walls, furniture, and other obstacles.
- Data Collection: It collects data on signal strength (RSSI) and presence detection in real-time.
- Visualization: The data is then presented in a 3D interface, allowing users to visually understand how the signal behaves in different parts of their environment.
- Optimization: Based on the visualization, users can make informed decisions about router placement, the addition of WiFi extenders, and other optimizations to improve signal strength and coverage.
Applications of WiFi Signal Visualization
WiFi signal visualization has a wide range of applications, from home networks to large-scale enterprise settings.
Home Networks
For home users, WiFi signal visualization can help optimize the placement of routers and extenders, ensuring that every corner of the house has a strong signal. This is particularly useful in larger homes or buildings with multiple floors, where signal strength can vary significantly.
Smart Homes and IoT Devices
In smart homes, where numerous IoT devices rely on a stable WiFi connection, visualization can help ensure that all devices are within range and have a strong signal. This can improve the reliability and performance of smart home systems, from security cameras to voice assistants.
Enterprise and Office Settings
In offices and enterprise settings, WiFi signal visualization can help IT administrators optimize network performance, ensuring that all employees have a strong and reliable connection. This is crucial for maintaining productivity and ensuring that critical applications run smoothly.
Health and Safety Monitoring
As mentioned, the software includes 'Vital Sign Monitoring' capabilities. This can be incredibly useful in healthcare settings, where monitoring patients' vital signs remotely can improve care and response times. The ability to detect presence and movement can also be a lifesaver in emergencies.
The Future of WiFi Technology
The advancement of WiFi technology continues to push the boundaries of what is possible. With innovations like the $9 chip that enhances signal penetration, the future of WiFi looks promising. As more devices become connected and rely on WiFi, the demand for better signal strength and coverage will only increase. Tools like WiFi signal visualization software will play a crucial role in meeting these demands, ensuring that users have a seamless and reliable connection.
Practical Tips
Optimizing Your WiFi Network
- Router Placement: Ensure your router is placed in a central location, away from obstacles like walls and large furniture. This can help maximize signal coverage.
- Use Extenders and Mesh Networks: If your home is large or has multiple floors, consider using WiFi extenders or mesh networks to boost signal strength in dead zones.
- Update Firmware: Regularly update your router's firmware to ensure you have the latest performance improvements and security patches.
- Minimize Interference: Keep your router away from other electronic devices that can cause interference, such as microwaves and cordless phones.
- Use Visualization Tools: Tools like the Dell software can help you visualize your WiFi signals and make data-driven decisions about optimizing your network.
Monitoring and Maintenance
- Regular Checks: Periodically check your WiFi signal strength and coverage to ensure everything is working optimally.
- Use Metrics: Pay attention to metrics like RSSI and presence detection to understand the performance of your network better.
- Address Issues Promptly: If you notice any dead zones or weak signal areas, take proactive steps to address them, such as moving your router or adding an extender.
Important Takeaways
- Visualization is Key: Understanding how your WiFi signals behave in your environment is crucial for optimizing your network.
- RSSI and Presence Detection Matter: These metrics provide valuable insights into signal strength and can help you monitor presence and movement.
- Innovation is Ongoing: Advancements like the $9 chip that enhances signal penetration show that WiFi technology is continuously improving.
- Practical Steps: Simple steps like optimizing router placement and using visualization tools can significantly enhance your WiFi experience.
Conclusion
WiFi signal visualization is a powerful tool that can transform how you understand and optimize your wireless network. By providing a clear visual representation of signal strength and penetration, along with metrics like RSSI and presence detection, this software helps users make informed decisions about their network setup. Whether you're a home user looking to eliminate dead zones or an enterprise IT administrator ensuring reliable connectivity, WiFi signal visualization offers valuable insights and practical benefits. As WiFi technology continues to evolve, tools like these will become even more essential, ensuring that we stay connected in an increasingly digital world.
Watch the Reel
Questions readers ask
What makes Dell's $9 chip unique for improving WiFi signals?
Dell's $9 chip is uniquely designed to penetrate walls, which significantly enhances WiFi performance by reducing the impact of physical barriers. This makes it an affordable solution for users experiencing dead zones in their WiFi coverage.
How can WiFi signal visualization help me understand my network better?
WiFi signal visualization tools provide a visual map of your network's signal strength and penetration. This helps you identify dead zones, optimize your router's placement, and understand how WiFi signals behave within your specific environment.
What is WiFi presence detection and how does it work?
WiFi presence detection uses signal monitoring to track the presence of devices within a network. This can help determine which devices are connected, and where they are located, providing useful insights into your network's usage and potential security.
Can I use WiFi signal visualization to improve my network's performance?
Yes, by using WiFi signal visualization, you can identify areas with weak signal strength and optimize your router's position. This can help reduce dead zones and enhance overall performance, making your network more reliable and efficient.
What are WiFi RSSI metrics and why are they important?
WiFi RSSI (Received Signal Strength Indicator) metrics measure the power present in a received radio signal. These metrics are important as they help assess the quality and strength of your WiFi signal, allowing you to pinpoint areas where improvements are needed.
How can I enhance my WiFi signal through walls using Dell's new chip?
Dell's $9 WiFi chip is specifically engineered to improve signal penetration through walls. Integrating this chip into your existing network can make a significant difference in covering hard-to-reach areas, thereby eliminating dead zones and ensuring a more stable connection.
What are some affordable ways to enhance WiFi performance in a home network?
Affordable solutions include using range extenders, updating your router's firmware, and relocating your router to a more central location. Additionally, integrating Dell's $9 WiFi chip can provide a cost-effective way to enhance signal penetration and overall performance.
Related deep dives
Similar reads based on topic and creator.




Recent articles
Fresh deep dives from the latest Reels we unpacked.




Comments
Be the first to comment.