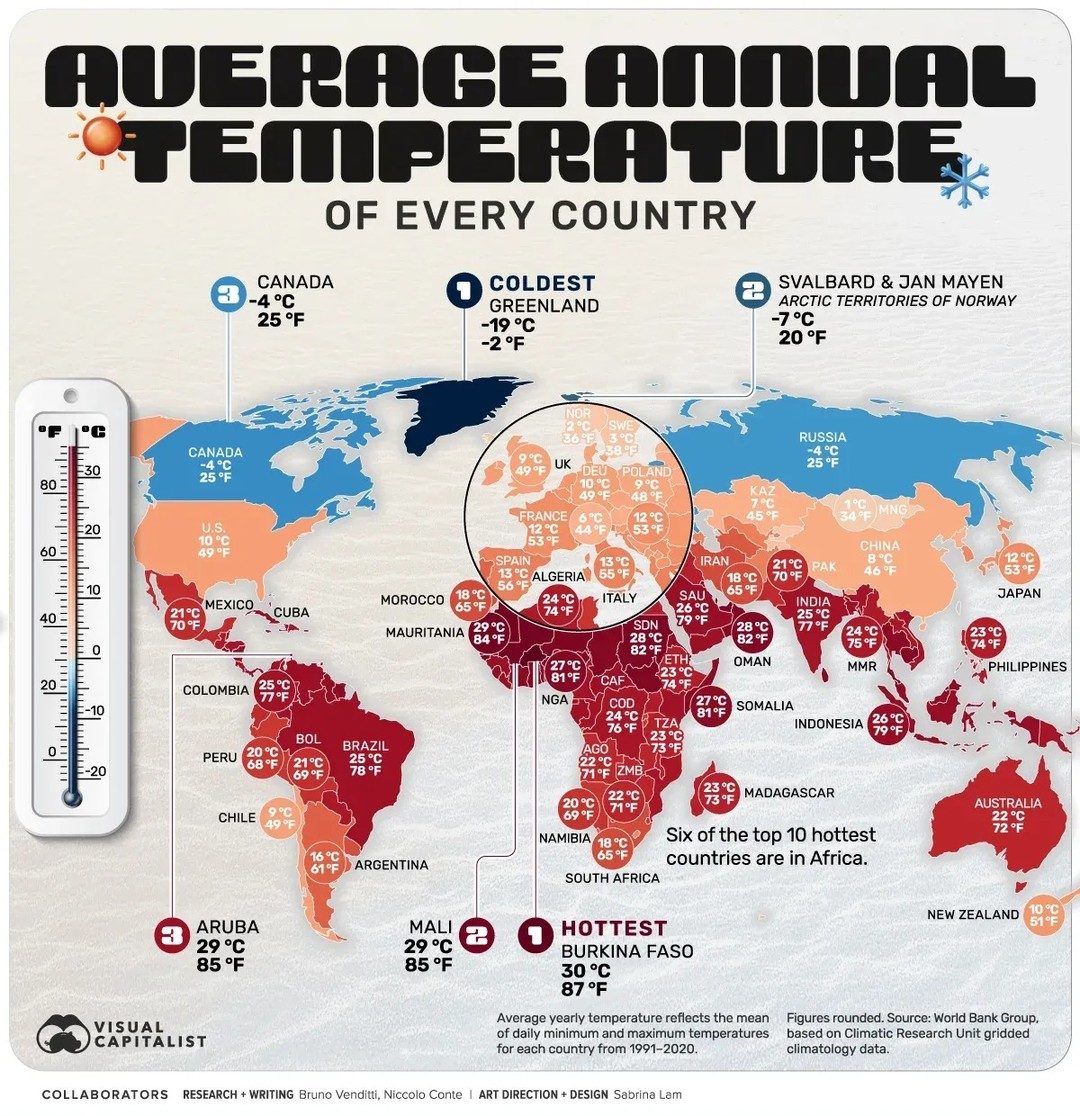
Global Temperature Comparison: A World Map Perspective
Climate data reveals striking contrasts around the globe, from the chilling winters of Greenland to the scorching heat of West Africa. This comparison of average annual temperatures across the world’s countries offers valuable insights, grounded in precise, contemporary data.
Context: Why this matters
Climate plays a crucial role in shaping the ecosystems, agriculture, and lifestyles of countries around the world. A comparison of average annual temperatures highlights the diversity of global climates, providing a foundation for understanding regional differences and global patterns. This information is essential for sectors like agriculture, energy consumption, tourism, and urban planning, helping stakeholders anticipate and adapt to climate-related challenges.
Main discussion
Global Temperature Variations
The Hottest Regions
Africa is home to some of the highest average annual temperatures on the planet, accounting for six of the top 10 hottest countries, including nations in the Sahara Desert. These countries experience average temperatures that frequently exceed 30°C. The intense heat affects everything from agricultural practices to energy consumption, requiring specialized infrastructure and adaptations to sustain life.
The Coldest Regions
On the opposite end of the spectrum, regions like Greenland and Svalbard & Jan Mayen stand out as the world's coldest. With average annual temperatures plummeting below -18°C, these areas are characterized by harsh, icy landscapes, and frigid conditions that make survival a constant challenge. The extreme cold necessitates cutting-edge technologies and robust infrastructure, such as insulated buildings and specialized heating systems.
Data Sources and Methodology
This analysis utilizes comprehensive data from the World Bank Group, which relies on the Climatic Research Unit (CRU) climatology data spanning from 1991 to 2020. This dataset provides a reliable and up-to-date reference for comparing the average annual temperatures of every country and territory worldwide. The figures are rounded for clarity, ensuring the data remains accessible and understandable.
Key Points and Patterns
The visual representation of this data reveals several notable patterns. For instance, the stark contrast between the temperate regions and the polar extremes underscores the vast differences in climate across the globe. This information is crucial for understanding regional climates and preparing for potential climate shifts. For example, countries can use this data to anticipate changes in agriculture, energy demand, and environmental conditions.
Regional Highlights
Africa: The Hot Continent
Africa's diverse geography results in a wide range of temperatures, from the extreme heat of the Sahara to the milder climates of coastal regions. The continent's hottest countries often experience temperatures exceeding 30°C, impacting everything from agriculture to wildlife. Understanding these temperature extremes is essential for sustainable development and environmental conservation.
The Arctic: A World of Ice
The Arctic, encompassing Greenland, Svalbard & Jan Mayen, and other polar regions, is characterized by its consistently low temperatures. These regions experience brutal winters with temperatures dropping below -18°C. The Arctic’s icy landscapes and harsh climate make it one of the least populated areas on Earth, yet it plays a critical role in global climate regulation.
How Temperatures Impact Daily Life
Agriculture and Food Security
Temperatures significantly influence agricultural practices. For instance, high temperatures in Africa necessitate drought-resistant crops and efficient irrigation systems. Conversely, the cold climates of the Arctic limit agricultural activities, focusing instead on livestock and hardy crops adapted to cold.
Energy Consumption and Infrastructure
Temperature extremes shape energy consumption patterns. Hot climates require robust cooling systems, while cold regions rely on advanced heating solutions. Infrastructure in both hot and cold climates must be designed to withstand extreme temperatures, ensuring the safety and comfort of residents.
Practical tips
When analyzing global temperature data, it’s essential to consider the following:
- Understand Local Context: Each region has unique characteristics and adaptations. What works in one area might not be suitable for another.
- Use Reliable Data Sources: Accurate and up-to-date data from reputable sources, like the World Bank Group, is crucial for making informed decisions.
- Consider Seasonal Variations: Annual averages can vary significantly based on local seasonal patterns. For example, a temperate country could experience extreme fluctuations in temperature throughout the year.
- Integrate with Climate Models: Combining temperature data with climate models can help predict future trends and adapt to potential changes.
Important takeaways
- Africa and the Arctic represent the extremes of global temperatures, with significant implications for agriculture, energy, and infrastructure.
- Data from the World Bank Group and Climatic Research Unit provides a reliable basis for understanding global temperature patterns.
- Adaptations to extreme temperatures are essential for sustainable development and environmental conservation.
- Regional differences in climate necessitate tailored solutions and strategies in planning and development.
Conclusion
Exploring the global landscape of average annual temperatures offers a comprehensive view of the world’s diverse climates. From the searing heat of Africa to the freezing cold of the Arctic, these extremes shape the daily lives, economies, and infrastructure of countries around the globe. By leveraging this data and understanding the unique challenges and adaptations of different regions, governments, and stakeholders can better prepare for and respond to climate-related challenges.
Watch the Reel
Questions readers ask
Which countries typically experience the highest temperatures on the global temperature map?
The hottest countries in the world, often found in Africa and the Middle East, dominate the highest temperature zones. Nations like Mali, Niger, and Djibouti, and countries in the Arabian Peninsula, frequently experience average annual temperatures exceeding 30°C (86°F).
What are the coldest regions highlighted in the world temperature map?
Greenland and Antarctica are among the coldest regions on Earth, with average annual temperatures often below 0°C (32°F). These areas experience prolonged periods of extreme cold, significantly impacting their ecosystems and human activities.
How does climate data by country influence agriculture and infrastructure?
Climate data is instrumental in shaping agricultural practices, as it helps farmers choose suitable crops and planting seasons. It also influences infrastructure development, guiding the design and maintenance of buildings, roads, and energy systems to withstand local climate conditions.
Why is a comparison of average annual temperatures valuable for understanding global climate patterns?
Comparing average annual temperatures offers a broad perspective on global climate patterns, highlighting regional differences and extremes. This information is vital for various sectors, including tourism, energy consumption, and urban planning.
How do temperature extremes affect daily life and infrastructure?
Extreme temperatures can significantly disrupt daily life, affecting everything from energy consumption to water availability. Infrastructure is particularly vulnerable, with extreme heat or cold potentially damaging buildings, roads, and public utilities, requiring specialized design and maintenance.
What are the hottest and coldest temperatures typically seen in Africa and Greenland, respectively?
In Africa, temperatures in regions like the Sahara Desert can exceed 50°C (122°F) during the day. Greenland, on the other hand, experiences average annual temperatures as low as -18°C (0°F), with some inland areas reaching -70°C (-94°F) in winter.
How can a global climate map aid in research on temperature extremes worldwide?
A global climate map serves as a powerful tool for researchers, enabling the visualization and analysis of temperature extremes worldwide. It helps identify patterns, trends, and anomalies, facilitating studies on climate change impacts and adaptation strategies.
Related deep dives
Similar reads based on topic and creator.

Recent articles
Fresh deep dives from the latest Reels we unpacked.




Comments
Be the first to comment.