Data Visualization Apps: The Future of Data Storytelling
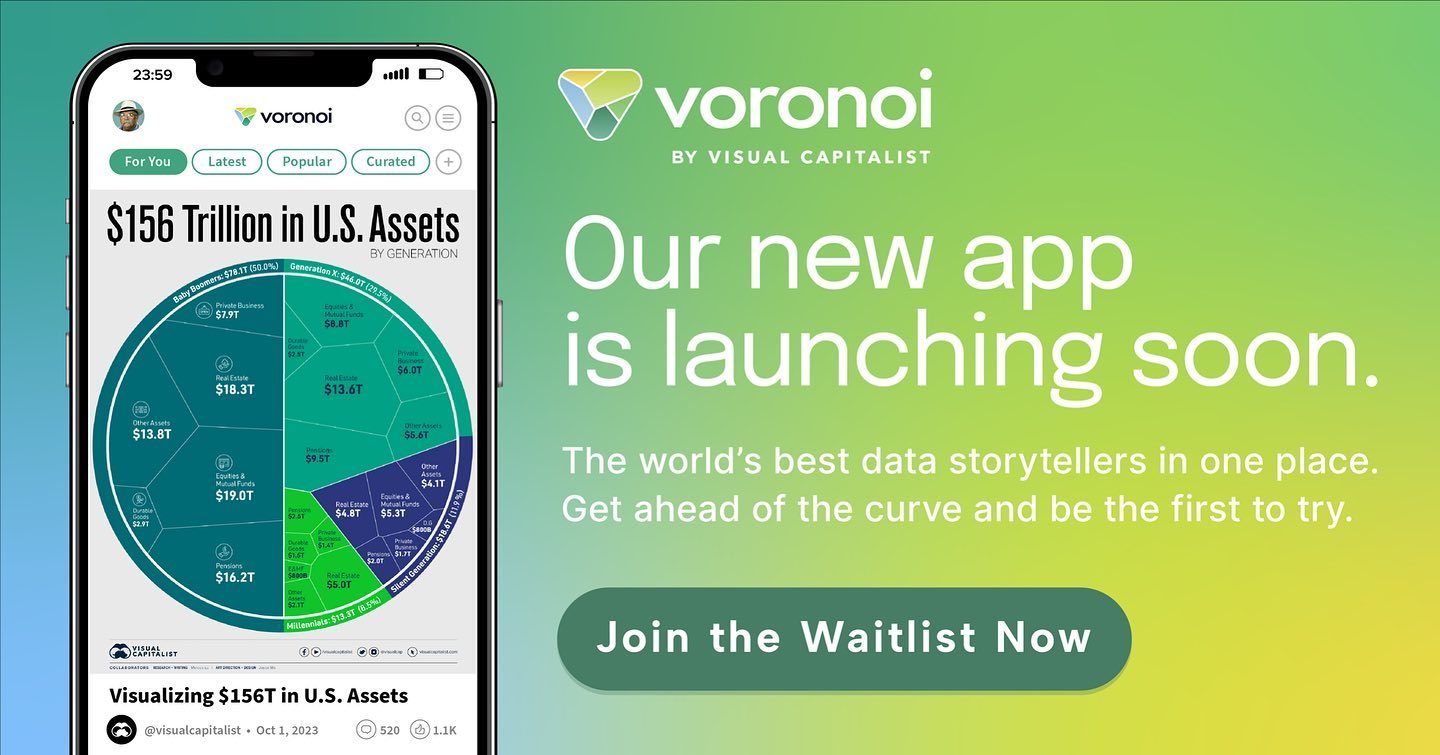
Data visualization apps are transforming how we understand and interact with complex data sets. By presenting information in a visual format, these apps make it easier to grasp trends, patterns, and insights that might otherwise go unnoticed. The upcoming launch of Visual Capitalist's VoronoiApp epitomizes this trend, promising to bring together the world's best data storytellers in one place.
Why Data Visualization Apps Matter
In today's data-driven world, the ability to effectively visualize and interpret data is crucial. Whether you're a business analyst, a researcher, or a curious individual, data visualization apps provide a powerful tool for making sense of the vast amounts of data generated daily. These apps not only simplify complex information but also make it more engaging and shareable.
Visual Capitalist's VoronoiApp aims to be at the forefront of this movement. By gathering the world's best data storytellers, the app seeks to offer a comprehensive platform where users can explore a wide range of data visualizations, from financial trends to environmental data. This democratization of data storytelling can empower more people to engage with and understand critical information.
Key Features of Data Visualization Apps
Interactive Visualizations
One of the standout features of data visualization apps is their interactivity. Unlike static graphs and charts, interactive visualizations allow users to drill down into the data, explore different angles, and gain deeper insights. This interactivity makes data more accessible and engaging, encouraging users to spend more time exploring and understanding the information presented.
Customizability
Another key feature of these apps is their customizability. Users can often tailor visualizations to their specific needs, choosing the data sets, visual styles, and formats that best suit their purposes. This flexibility makes data visualization apps valuable tools for a wide range of users, from professionals to hobbyists.
Collaboration and Sharing
Many data visualization apps also offer collaboration and sharing features. Users can work together on visualizations, share their findings with colleagues or the broader community, and even embed visualizations in reports or presentations. This collaborative aspect enhances the value of data visualization, making it a powerful tool for teamwork and communication.
Real-Time Data Updates
Some advanced data visualization apps provide real-time data updates, allowing users to monitor changes as they happen. This feature is particularly useful for fields like finance, where timely information can make a significant difference. Real-time updates ensure that users are always working with the most current data, enhancing the accuracy and relevance of their insights.
Practical Tips for Using Data Visualization Apps
Choose the Right Tool
With so many data visualization apps available, it's important to choose the one that best fits your needs. Consider the types of data you'll be working with, the features you require, and your budget. For example, if you need to visualize financial data, you might look for an app that specializes in financial charts and graphs.
Start with a Clear Objective
Before diving into data visualization, have a clear objective in mind. What insights are you hoping to gain? What questions do you want to answer? Having a clear goal will help you create more focused and effective visualizations.
Use High-Quality Data
The quality of your data visualization depends on the quality of your data. Ensure that your data is accurate, complete, and relevant to your objectives. Clean and preprocess your data as needed to remove any inconsistencies or errors.
Experiment with Different Visualizations
Don't be afraid to experiment with different types of visualizations. Bar charts, line graphs, pie charts, and heat maps all have their strengths and weaknesses. Try out different formats to see which one best presents your data and conveys your message.
Engage with the Community
Join online communities and forums dedicated to data visualization. Engaging with other users can provide valuable insights, tips, and inspiration. You can also share your own work, receive feedback, and collaborate with others.
Important Takeaways
Data visualization apps are revolutionizing how we interact with and understand data. By making complex information more accessible, engaging, and shareable, these apps are empowering individuals and organizations to make better-informed decisions. With the imminent launch of VoronoiApp, Visual Capitalist is poised to become a leading platform for data storytelling, bringing together the best minds in the field and offering a wealth of insights and visualizations.
As data continues to grow in importance, the ability to effectively visualize and interpret it will become increasingly valuable. Whether you're a seasoned professional or a curious beginner, data visualization apps offer a powerful tool for navigating the data landscape and gaining meaningful insights.
Conclusion
The future of data storytelling is bright, and data visualization apps are at the forefront of this exciting development. With their interactive, customizable, and collaborative features, these apps are making data more accessible and engaging than ever before. As new tools like Visual Capitalist's VoronoiApp enter the market, the possibilities for data visualization are expanding, paving the way for a more data-literate world.
Watch the Reel
Questions readers ask
What is VoronoiApp and how does it enhance data storytelling?
VoronoiApp is an innovative platform developed by Visual Capitalist that brings together top data storytellers to transform complex data into engaging and interactive visualizations. By making data more accessible, it enhances the storytelling process, allowing users to explore and understand data in new ways.
How does VoronoiApp democratize data visualization?
VoronoiApp empowers users by providing interactive and customizable visualizations. This approach allows anyone, regardless of their technical background, to create and explore data visualizations, making data storytelling more inclusive and accessible to a broader audience.
What are the key features of VoronoiApp?
VoronoiApp offers a range of features including interactive data visualization, customizable visualizations, and the ability to connect with top data storytellers. These features make it a powerful tool for creating engaging data presentations and exploring data assets in a comprehensive manner.
Why is data visualization important in today's data-driven world?
Data visualization is crucial because it simplifies complex information, making it easier to identify trends, patterns, and insights. With the vast amounts of data generated daily, effective visualization helps individuals and organizations make informed decisions quickly and efficiently.
How can I get started with VoronoiApp?
To get started with VoronoiApp, you can join the waitlist for early access. Once available, you can explore the platform's features, connect with top data storytellers, and begin creating your own interactive and customizable data visualizations to enhance your data presentations.
Related deep dives
Similar reads based on topic and creator.


Recent articles
Fresh deep dives from the latest Reels we unpacked.




Comments
Be the first to comment.