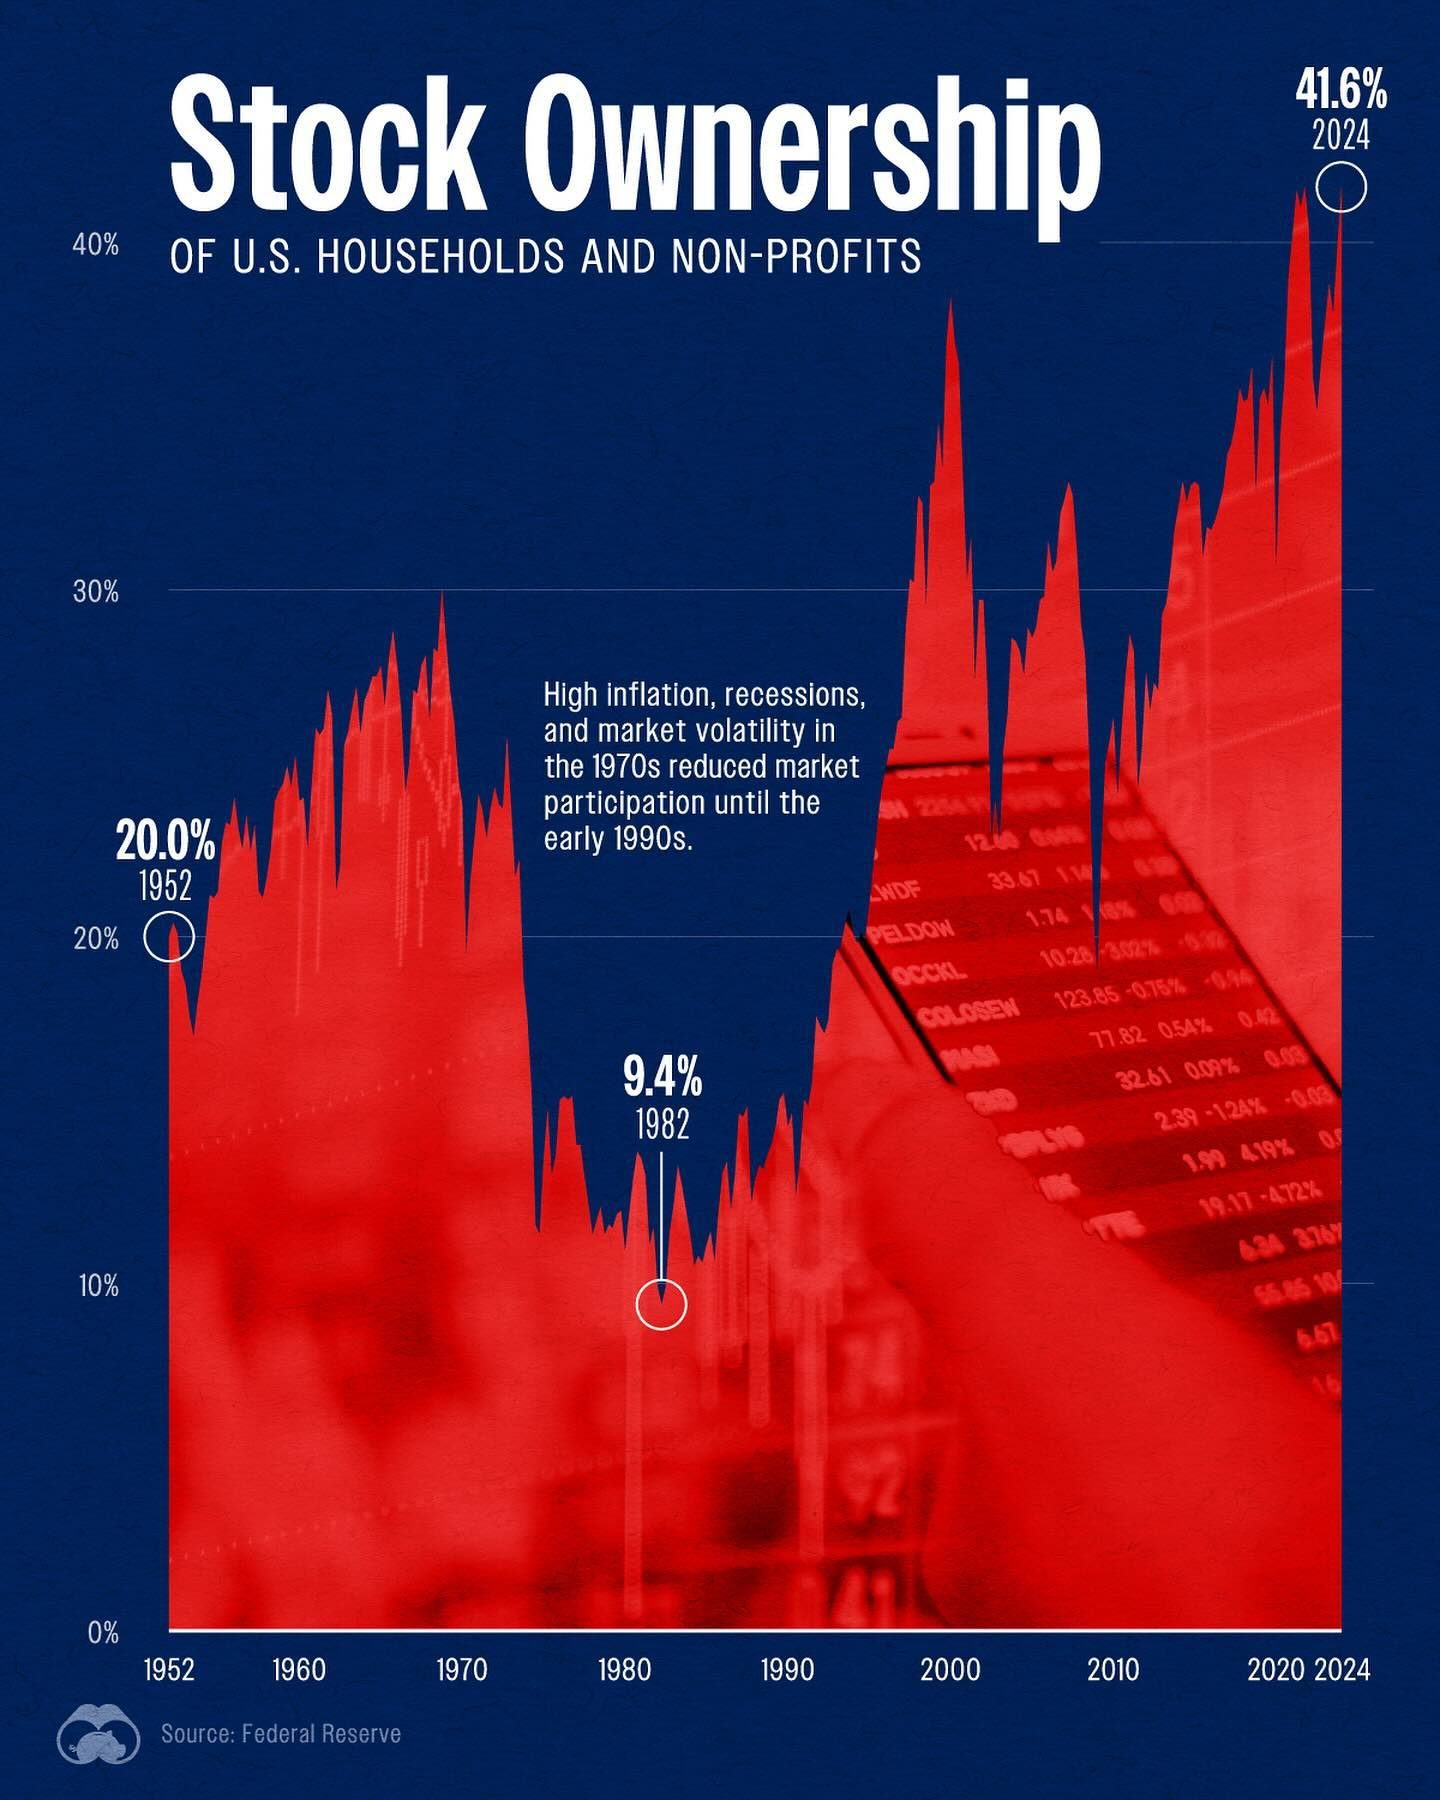
The Evolution of Stock Ownership in the U.S. from 1952 to 2024
Context / Why this matters
In 2024, a significant portion of households, 41.6%, have their financial assets invested in the stock market. This trend is driven by investor confidence, a robust U.S. economy, and the consistent performance of the stock market over the years. Understanding the historical context and trends of stock ownership among U.S. households and non-profits provides valuable insights into the economic landscape and the factors influencing investment decisions.
Main discussion
Stock ownership trends among U.S. households and non-profits have shown considerable fluctuations over the years. Several key periods and events have significantly impacted market participation.
The Early Years: 1952 to 1970
The data from the Federal Reserve indicates a modest start to stock ownership in the 1950s and 1960s. By 1960, around 33.41% of households and non-profits had their financial assets tied to the stock market. However, the economic landscape began to change in the 1970s, marked by high inflation, recessions, and market volatility. This period saw a significant decline in market participation, dropping to around 12.46% by 1972. These economic challenges made the stock market a less attractive option for many investors, leading to a prolonged period of reduced participation.
The Recovery and Growth: 1980s to 2000
The 1980s marked a turning point with a resurgence in stock market participation. By 1982, the percentage of households and non-profits investing in the stock market had increased to 41.9%, a significant rise from the previous decade. This uptick can be attributed to a more stable economic environment and the implementation of policies that encouraged investment. The 1990s continued this upward trend, with stock ownership reaching 77.82% by 1990. The strong performance of the market during this period further bolstered investor confidence, making stocks a popular investment choice.
Recent Trends: 2000 to 2024
The early 2000s saw a slight dip in stock ownership, possibly due to the dot-com bubble burst and the 2008 financial crisis. However, by 2020, the percentage of households and non-profits with financial assets in the stock market had recovered to 19.17%. This recovery can be tied to the robust economic performance and the strong performance of the stock market. As of 2024, 41.6% of U.S. households have their financial assets invested in the stock market, continuing the trend of strong equity allocations.
Practical tips
For investors looking to understand and capitalize on these trends, several practical tips can be helpful:
Diversify Your Portfolio
Given the historical fluctuations in stock ownership, it's crucial to diversify your portfolio. Investing in a mix of stocks, bonds, and other assets can help mitigate risks and ensure stability during market volatility.
Stay Informed
Keeping up with economic indicators and market trends is essential. Understanding the broader economic context can help you make informed investment decisions and navigate market fluctuations more effectively.
Long-Term Perspective
Adopting a long-term investment perspective can be beneficial. Historical data shows that, despite short-term volatility, the stock market has consistently performed well over extended periods.
Seek Professional Advice
Consulting with a financial advisor can provide valuable insights and help you develop a tailored investment strategy that aligns with your financial goals and risk tolerance.
Important takeaways
Historical data on stock ownership among U.S. households and non-profits reveals several important takeaways:
-
Market Volatility and Economic Conditions: High inflation, recessions, and market volatility significantly impact stock ownership trends. Periods of economic instability tend to reduce market participation, while stable economies encourage investment.
-
Long-Term Performance: Over the long term, the stock market has shown strong performance, making it a popular investment choice for many households.
-
Policy and Regulatory Environment: Policies encouraging investment and a stable regulatory environment can significantly boost market participation.
-
Investor Confidence: Confidence in the stock market, fuelled by consistent performance and economic stability, drives higher equity allocations.
-
Economic Cycles: Understanding the cycles of economic boom and bust can help investors make more informed decisions and navigate market fluctuations.
Conclusion
The trend of stock ownership among U.S. households and non-profits from 1952 to 2024 provides valuable insights into the economic landscape and the factors influencing investment decisions. Understanding these historical trends can help current and potential investors make informed decisions, diversify their portfolios, and stay informed about market trends. By leveraging this knowledge, investors can better navigate the complexities of the stock market and achieve their financial goals.
Watch the Reel
Questions readers ask
What was the stock ownership rate like in the 1970s?
In the 1970s, U.S. stock ownership rates were relatively low. This period was marked by economic instability, including high inflation and stagnant growth, which led many households to avoid the stock market.
How have federal policies influenced stock ownership trends?
Federal policies have played a significant role in shaping stock ownership trends. For instance, policies encouraging investment, such as tax incentives and retirement savings plans, have contributed to the resurgence of stock ownership in recent decades.
What role does the Federal Reserve play in stock ownership trends?
The Federal Reserve influences stock ownership trends through its monetary policies. By controlling interest rates and managing inflation, the Federal Reserve affects investor confidence and the overall attractiveness of the stock market.
Why is understanding historic stock ownership trends important?
Understanding historic stock ownership trends helps to identify patterns and factors that influence investor behavior. This knowledge can assist in predicting future trends and making informed investment decisions.
What is the current stock ownership rate among U.S. households?
As of 2024, approximately 41.6% of U.S. households have their financial assets invested in the stock market. This high level of participation reflects current economic stability and consistent market performance.
How do non-profits fit into the trends of stock ownership?
Non-profits, like households, have seen fluctuations in stock ownership. Non-profits often invest in the stock market to grow their endowments and support their missions. Trends among non-profits can provide additional insights into the broader economic landscape and investment strategies.
What data visualizations are available to track stock ownership trends?
Several data visualizations are available to track stock ownership trends, including charts and graphs that show the percentage of households and non-profits owning stocks over time. These visuals can help illustrate the impact of economic events and policies on market participation.
Related deep dives
Similar reads based on topic and creator.


Recent articles
Fresh deep dives from the latest Reels we unpacked.




Comments
Be the first to comment.