U.S. Recessions and Stock Market Declines
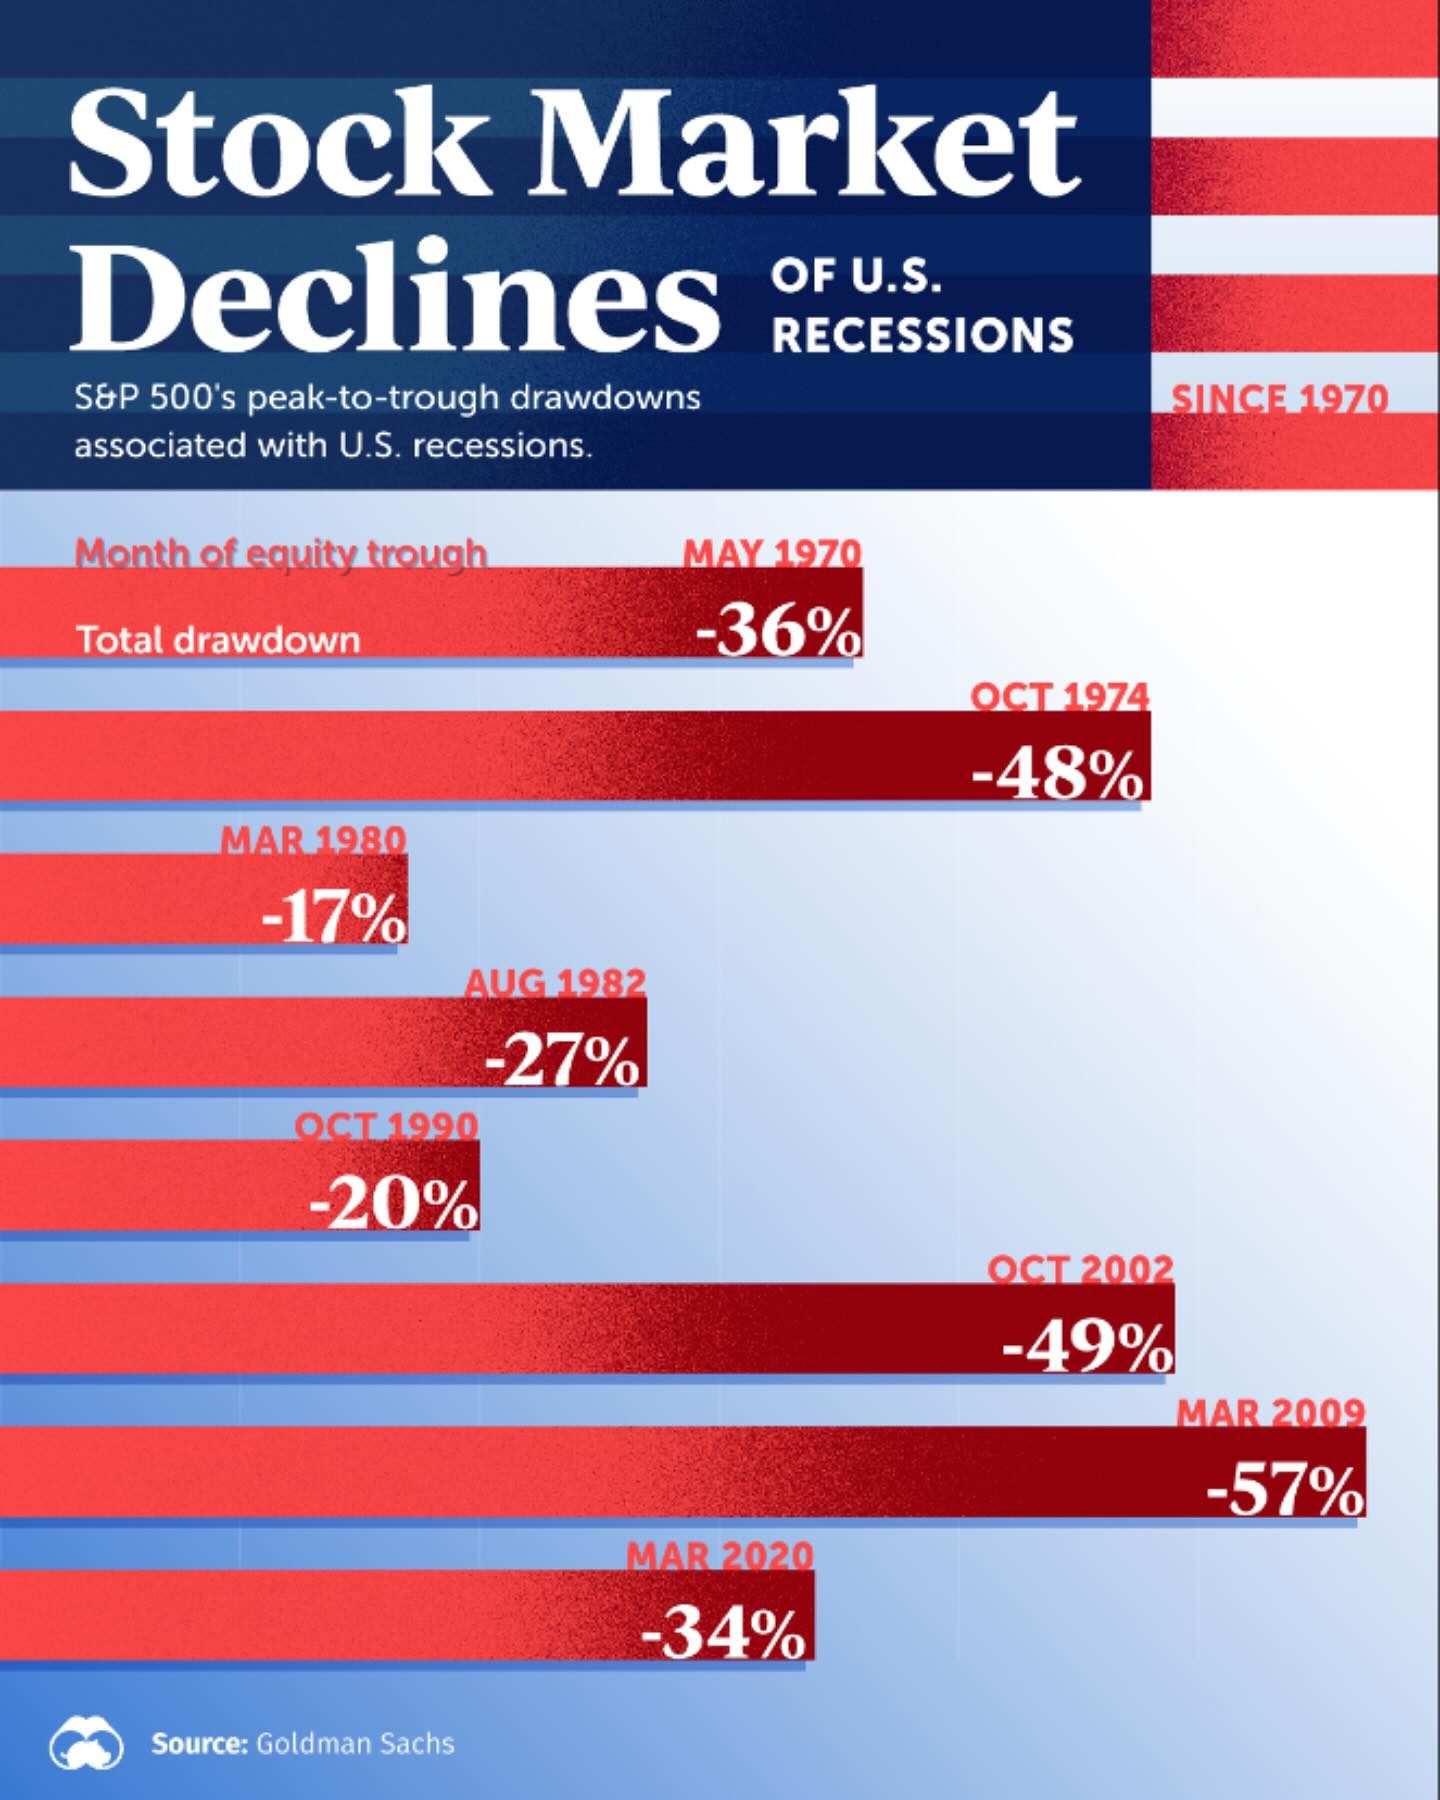
The U.S. stock market has experienced significant declines during recessions, with the most severe drops showcasing the market's volatility and sensitivity to economic downturns. The global financial crisis in 2009 marked the largest decline, with the S&P 500 losing over half of its value. The bursting of the dot-com bubble in 2002 was the second-worst, with the S&P 500 falling 49% from its peak. These events highlight the dramatic impact recessions can have on the stock market.
Why This Matters
Understanding the historical context of stock market declines during recessions is crucial for investors and economists. It provides insights into market behavior, helps in risk management, and aids in predicting future market trends. By examining the peak-to-trough drawdowns of the S&P 500 during U.S. recessions since 1970, as documented by Goldman Sachs, we can gain a clearer picture of how the market responds to economic crises.
Historical Stock Market Declines
The 1970s: Volatile Economic Landscape
The 1970s were a tumultuous period for the U.S. economy, marked by high inflation, oil shocks, and multiple recessions. The S&P 500 experienced significant drawdowns during this decade.
- May 1970: The market saw a -36% decline, reflecting the economic uncertainties of the time.
- October 1974: This period marked a -48% drawdown, one of the most severe declines in U.S. history, driven by the 1973-1974 stock market crash and the 1973 oil embargo.
- March 1980: The market experienced a -17% decline, influenced by the Iranian Revolution and the resulting oil shock.
- August 1982: A -27% drawdown occurred, reflecting the deep recession of 1981-1982 and high interest rates.
The 1990s: Economic Challenges
The 1990s brought significant economic events, including the Savings and Loan crisis and the Gulf War.
- October 1990: The S&P 500 declined by -20%, largely due to the economic slowdown and the Gulf War.
The 2000s: The Dot-Com Bust and Financial Crisis
The early 2000s were characterized by the bursting of the dot-com bubble and the subsequent financial crisis.
- October 2002: The market saw a -49% decline, primarily due to the tech bubble burst and the 9/11 terrorist attacks.
- March 2009: The global financial crisis led to a -57% drawdown, the most severe decline in recent history, driven by the subprime mortgage crisis and the ensuing global recession.
The most recent significant decline occurred in:
- March 2020: The S&P 500 experienced a -34% drawdown, partly due to the COVID-19 pandemic and the resulting economic shutdown.
Practical Tips for Navigating Economic Downturns
For investors navigating economic downturns, understanding historical market behavior can provide valuable guidance. Here are some practical tips:
Diversify Your Portfolio
Diversification is key to managing risk. Spread investments across different sectors and asset classes to mitigate the impact of market downturns.
Stay Informed
Keep abreast of economic indicators and market trends. Staying informed can help in making timely investment decisions.
Maintain a Long-Term Perspective
Market downturns are often temporary. Maintain a long-term investment horizon and avoid panicked selling.
Consider Defensive Stocks
Invest in defensive sectors such as healthcare, utilities, and consumer staples, which tend to perform better during recessions.
Regularly Review and Adjust Your Strategy
Regularly review your investment strategy and adjust it based on changing economic conditions and market trends.
Important Takeaways
Historical data on stock market declines during U.S. recessions provides valuable insights into market behavior and helps in risk management. Key takeaways include:
- Market Volatility: The stock market can experience significant volatility during economic downturns, with severe declines.
- Historical Patterns: Patterns observed in past recessions can offer clues about future market performance.
- Economic Context: Understanding the economic context of past declines, such as oil shocks or financial crises, can help in anticipating market reactions to current events.
Conclusion
The historical performance of the S&P 500 during U.S. recessions since 1970 offers a compelling narrative of market volatility and resilience. By examining the peak-to-trough drawdowns, we gain insights into how the market responds to economic crises and can apply these lessons to inform investment strategies. Always remember to stay informed, diversify your portfolio, and maintain a long-term perspective to navigate economic downturns effectively.
Watch the Reel
Questions readers ask
What were the most significant U.S. stock market declines during the 1970s?
The 1970s were marked by two significant stock market declines. The first occurred in 1973-1974, where the S&P 500 dropped by 48% due to an oil embargo and rising inflation. The second decline happened in 1978-1980, where the market fell by 20% following a period of high unemployment and interest rates. These events are notable for their severity and impact on the broader economy.
What caused the 2009 stock market decline, and how did it compare to other recessions?
The 2009 stock market decline was primarily caused by the global financial crisis, which resulted from the subprime mortgage crisis. The S&P 500 lost over 50% of its value, making it the largest decline in U.S. history. This event stands out due to its magnitude and the subsequent slow recovery, which differed from other recessions in terms of severity and duration.
How does the dot-com bubble bursting in 2002 compare to other major stock market declines?
The dot-com bubble bursting in 2002 resulted in the S&P 500 falling by 49% from its peak. This event is notable as the second-worst decline in U.S. history, surpassed only by the 2009 financial crisis. The dot-com bubble is significant because it highlights the risks associated with speculative investing and market bubbles.
What can investors learn from historic stock market crashes during recessions?
Investors can gain valuable insights from historic stock market crashes by understanding market behavior during economic downturns. By examining past events, investors can identify patterns, assess risk, and develop strategies to navigate future market volatility. Additionally, these insights help in making informed decisions about asset allocation and investment timing during recessions.
What are the key insights from examining U.S. stock market peak and trough during recessions?
Examining the U.S. stock market peaks and troughs during recessions reveals important trends, such as the frequency and magnitude of market drawdowns. This analysis can help investors and economists understand the market's sensitivity to economic indicators and predict future trends. Additionally, it highlights the importance of diversification and long-term investment strategies during economic downturns.
What is the significance of the Goldman Sachs recession list?
The Goldman Sachs recession list highlights key economic indicators and historical trends that have preceded and followed recessions. By examining this list, investors can gain a better understanding of potential market trends and the broader economic context. It serves as a resource for identifying warning signs and preparing for future economic downturns. It also provides a historical perspective on market behavior during recessions.
Related deep dives
Similar reads based on topic and creator.


Recent articles
Fresh deep dives from the latest Reels we unpacked.




Comments
Be the first to comment.