U.S. Home Price Growth Over 50 Years
The trajectory of U.S. home prices over the past 50 years has been a rollercoaster ride, marked by significant peaks and troughs. Understanding this journey is crucial for anyone interested in real estate, economics, or long-term financial planning.
Context / Why this Matters
The housing market is one of the most rate-sensitive sectors in the economy. Home prices are influenced by a multitude of factors, including interest rates, economic conditions, and demographic trends. By examining the nominal and real home price changes from 1971 to 2022, we can gain insights into how these factors have shaped the market over time.
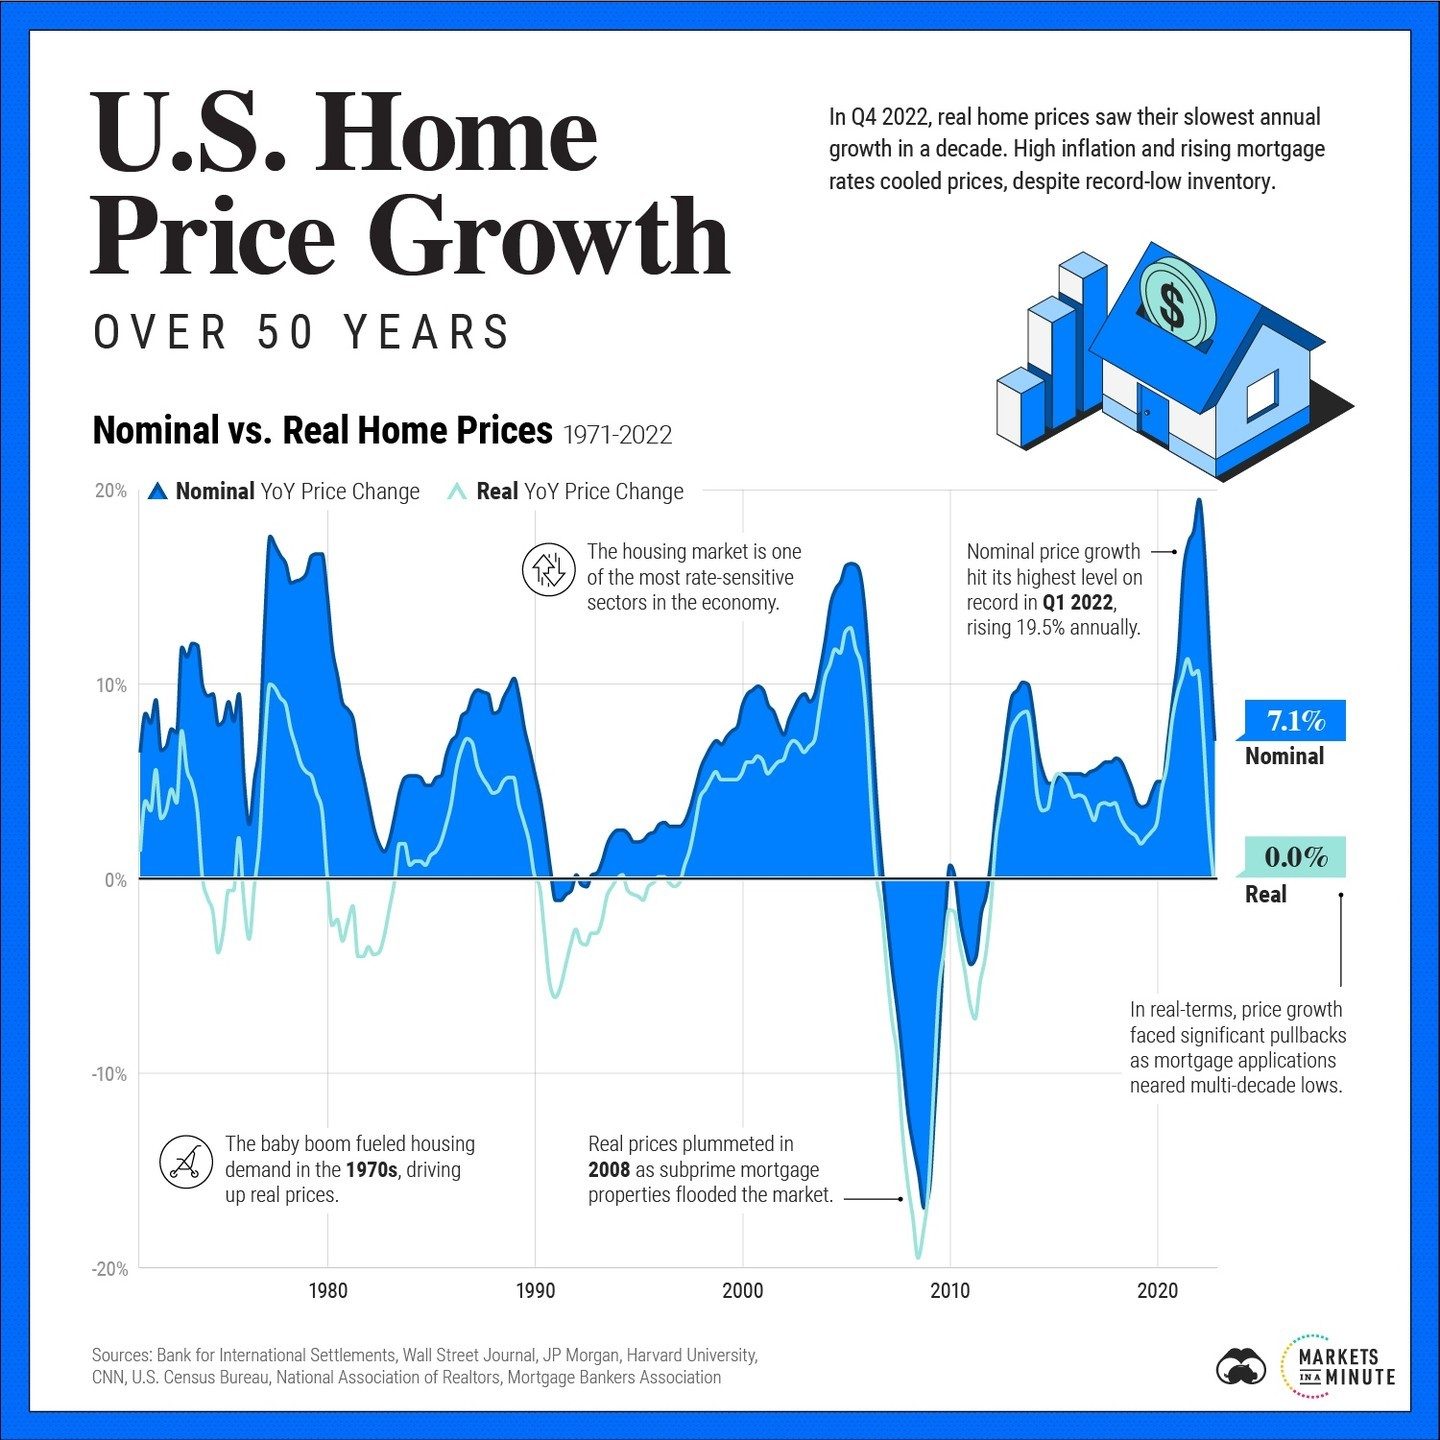
The baby boom of the 1970s, for instance, fueled a surge in housing demand, driving up real prices. Conversely, the 2008 financial crisis, triggered by the subprime mortgage crisis, led to a sharp decline in real home prices. These historical events highlight the volatility and sensitivity of the housing market to broader economic conditions.
But how much did the housing market actually grow? According to the graph, nominal price growth peaked in Q1 2022, rising 19.5% annually. Yet, in inflation-adjusted terms, this growth rate was far lower. By Q4 2022, it fell to being flat year-on-year, making it the slowest real growth seen in a decade.
Main discussion
The 1970s: A Decade of Growth
The 1970s saw a significant rise in home prices, driven largely by the baby boom generation entering the housing market. This demographic shift increased demand for housing, leading to a steady climb in real prices. The economic conditions of the time, including stable interest rates and a growing economy, further supported this trend. Nominal prices during this period reflected strong growth, mirroring the overall economic optimism.
The 1980s and 1990s: Stability and Moderate Growth
Following the boom of the 1970s, the 1980s and 1990s were characterized by more stable and moderate growth in home prices. The housing market experienced fewer dramatic fluctuations, with nominal prices continuing to rise at a steady pace. Real prices also showed consistent growth, though at a slower rate compared to the previous decade.
During this period, several factors contributed to the stability of the housing market. Interest rates remained relatively stable, and the economy experienced steady growth. Additionally, regulatory changes and the introduction of new financial instruments helped to stabilize the market, preventing the kind of volatility seen in the 1970s.
The 2000s: The Housing Bubble and Financial Crisis
The early 2000s saw a significant surge in home prices, driven by a combination of low interest rates, easy credit, and speculative investment. This period is often referred to as the "housing bubble," and it reached its peak in 2006. However, the bubble burst in 2008, leading to a sharp decline in real home prices. The subprime mortgage crisis, characterized by a flood of subprime mortgage properties, played a pivotal role in this decline. The financial crisis that followed had long-lasting effects on the housing market and the broader economy.
The 2010s: Recovery and Steady Growth
Following the financial crisis, the 2010s saw a gradual recovery in the housing market. Nominal prices began to rise again, driven by a combination of low interest rates, an improving economy, and increasing housing demand. Real prices also showed signs of recovery, though the pace of growth was slower compared to the pre-crisis era. The housing market during this decade was marked by stability and steady growth, with fewer dramatic fluctuations.
The 2020s: Recent Trends and Future Outlook
The 2020s brought new challenges and opportunities to the housing market. The COVID-19 pandemic, for instance, led to a surge in demand for single-family homes, driven by factors such as remote work and changing lifestyle preferences. This demand, coupled with supply chain disruptions and low inventory, led to a significant rise in home prices. However, the recent increase in interest rates and economic uncertainty have posed new challenges for the market.
In Q1 2022, nominal price growth peaked at 19.5% annually, reflecting the strong demand and low inventory. However, by Q4 2022, real price growth had slowed to 0.0% year-on-year, making it the slowest real growth seen in a decade.
Practical Tips
When navigating the housing market, it's essential to stay informed about current trends and historical data. Here are some practical tips to help you make informed decisions:
- Stay Informed About Economic Indicators: Keep an eye on key economic indicators, such as interest rates, inflation, and employment data. These factors can significantly impact the housing market and home prices.
- Understand the Historical Context: Knowing how home prices have behaved in the past can help you anticipate future trends. For example, historical data shows that periods of high inflation often correlate with slower real price growth in the housing market.
- Consider Long-Term Trends: While short-term fluctuations can be dramatic, long-term trends often provide a more reliable indicator of market direction. By focusing on long-term trends, you can make more informed decisions about when and where to buy.
- Evaluate Local Market Conditions: Home prices can vary significantly from one region to another. Be sure to evaluate local market conditions, including supply and demand dynamics, to get a clearer picture of the housing market in your area.
- Factor in Interest Rates: Interest rates play a crucial role in the housing market. High interest rates can make mortgages more expensive, reducing demand and slowing price growth. Conversely, low interest rates can stimulate demand and drive up home prices.
- Monitor Policy Changes: Government policies, such as tax incentives or regulatory changes, can also impact the housing market. Stay informed about potential policy changes and their implications for the market.
Important Takeaways
- Historical Context Matters: The housing market is influenced by a range of historical and economic factors. Understanding these factors can help you anticipate future trends and make more informed decisions.
- Nominal vs. Real Prices: Nominal price growth can be misleading without considering inflation. Real prices, adjusted for inflation, provide a more accurate picture of the housing market's performance.
- Economic Indicators: Key economic indicators, such as interest rates and employment data, can significantly impact the housing market. Staying informed about these indicators can help you navigate the market more effectively.
- Demographic Trends: Demographic factors, such as the baby boom and changes in lifestyle preferences, can drive demand and influence home prices. Understanding these trends can help you anticipate future market movements.
- Volatility and Sensitivity: The housing market is highly sensitive to broader economic conditions and can experience significant volatility. Being aware of this volatility can help you make more informed decisions and prepare for potential market shifts.
Conclusion
The journey of U.S. home prices over the past 50 years is a story of peaks and valleys, driven by a multitude of economic and demographic factors. From the baby boom-driven growth of the 1970s to the recovery of the 2010s, and the recent trends of the 2020s, the housing market has seen it all. By understanding these trends and their underlying causes, you can make more informed decisions about buying, selling, or investing in real estate. Whether you're a first-time homebuyer, a seasoned investor, or simply curious about the housing market, staying informed about these trends is crucial for navigating the complexities of the real estate landscape.
Watch the Reel
Questions readers ask
What were the key factors driving U.S. home prices in the 1970s?
The 1970s saw a significant surge in U.S. home prices primarily due to the baby boom, which increased demand for housing. Additionally, economic conditions, such as inflation and interest rates, played a substantial role in shaping home price trends during this decade.
How did the 2008 financial crisis impact U.S. home prices?
The 2008 financial crisis led to a sharp decline in U.S. home prices due to a combination of factors including a surge in foreclosures, a decrease in consumer confidence, and a tightening of lending standards. This period is marked by substantial volatility and a significant correction in the housing market.
What role do interest rates play in the fluctuations of U.S. home prices?
Interest rates significantly influence U.S. home prices because they affect the cost of borrowing for homebuyers. When interest rates are low, mortgages become more affordable, increasing demand and driving up prices. Conversely, high interest rates can decrease demand and lead to a decline in home prices.
How have year-over-year home prices changed from 1971 to 2022?
From 1971 to 2022, U.S. home prices experienced both substantial growth and periods of decline. Nominal prices generally trended upwards, but when adjusted for inflation, the picture shows more variability, with periods of real price growth and contraction, influenced by economic cycles and demographic shifts.
What insights can be gained from examining historical home price data?
Examining historical home price data provides valuable context for understanding current market trends and future projections. By analyzing past price changes, economic conditions, and demographic trends, investors and analysts can make more informed decisions about the real estate market.
What is the home price index, and why is it important?
The home price index is a measurement tool that tracks changes in home prices over time. It is crucial for analyzing long-term trends in the real estate market, comparing price levels across different regions, and assessing the impact of economic conditions on housing affordability.
What does looking at inflation-adjusted home prices reveal about market trends?
Inflation-adjusted home prices provide a clearer picture of real price changes by accounting for the erosion of purchasing power due to inflation. This view reveals periods of genuine price growth or decline, independent of general price inflation, offering a more accurate reflection of the market's health and affordability over time.
Related deep dives
Similar reads based on topic and creator.


Recent articles
Fresh deep dives from the latest Reels we unpacked.




Comments
Be the first to comment.