Understanding SEO Success with Data Analytics
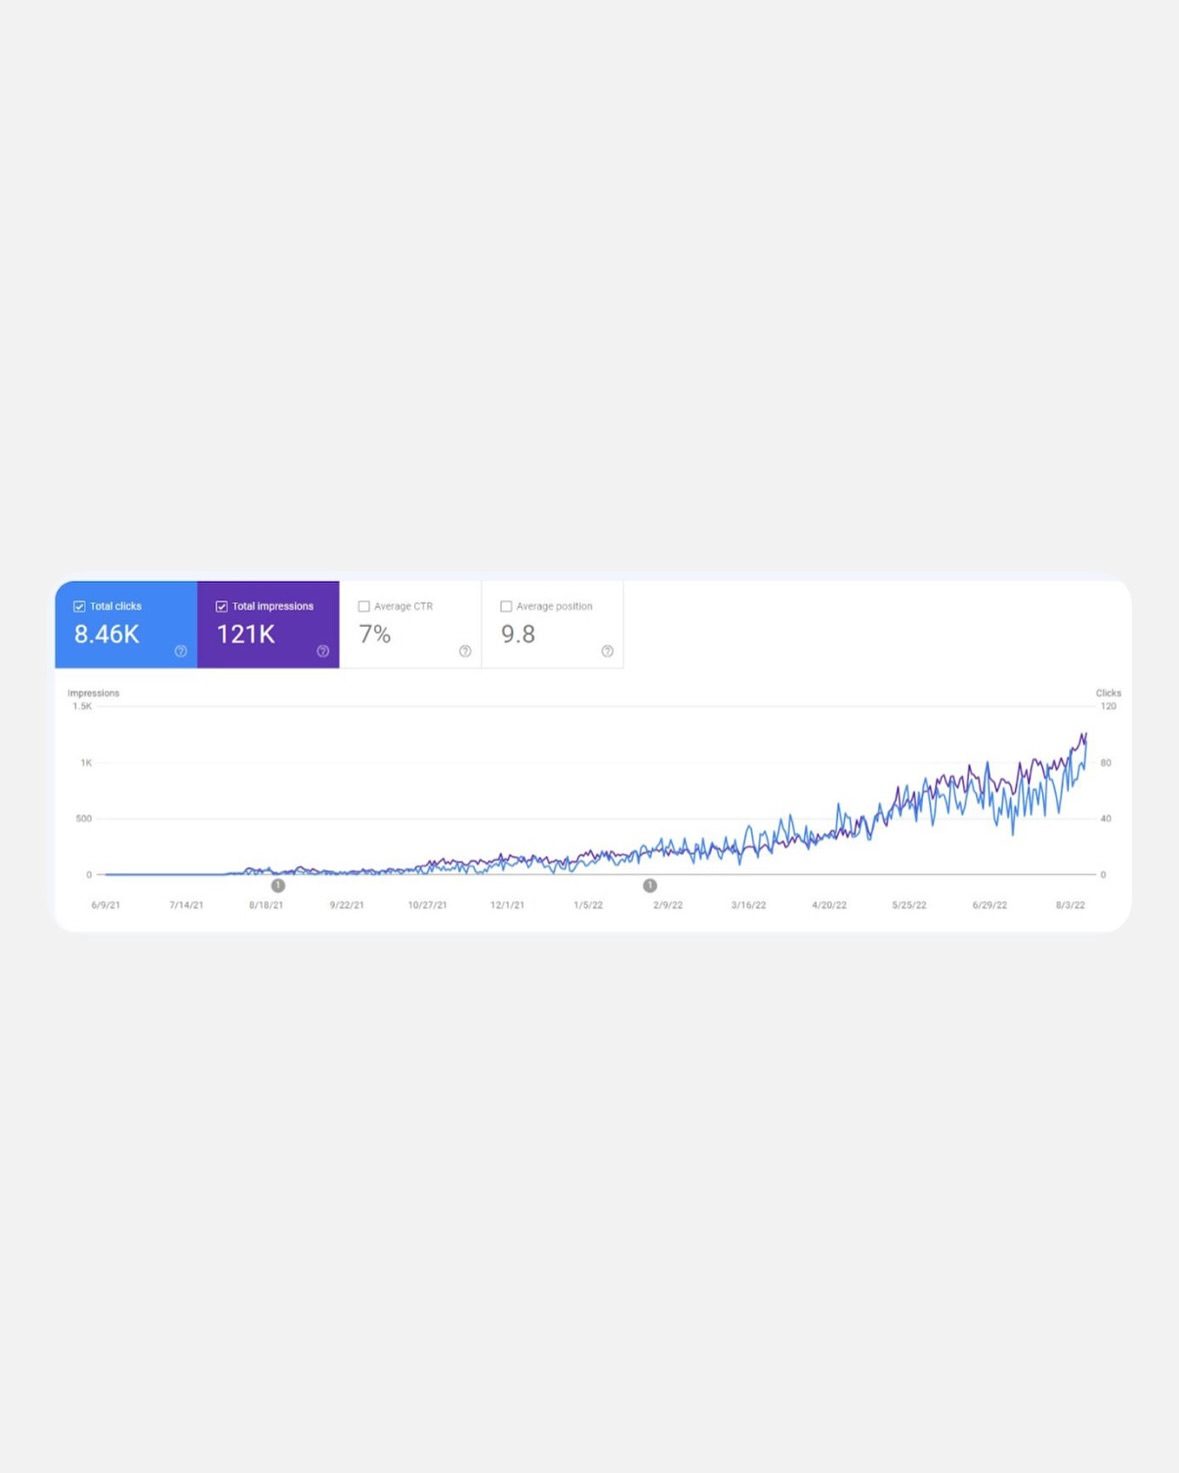
SEO (Search Engine Optimization) is a critical component of digital marketing. Success in this field often hinges on the ability to analyze and interpret data effectively. One key tool that can provide invaluable insights is a data analytics dashboard. This dashboard showcases various metrics that can help you understand the performance of your SEO strategies and make data-driven decisions.
Why This Matters
In the competitive landscape of SEO, having a clear understanding of your performance metrics is essential. This understanding allows you to identify what's working and what's not, enabling you to optimize your strategies for better results. The data analytics dashboard is a powerful tool in this regard, providing a comprehensive view of key performance indicators (KPIs) such as total clicks, total impressions, average click-through rate (CTR), and average position.
Main Discussion
Key Metrics in SEO Analytics
When diving into SEO analytics, several key metrics stand out:
-
Total Clicks: This metric indicates the number of times users have clicked on your content from search engine results. Higher click numbers usually suggest that your content is appealing and relevant to the search queries.
-
Total Impressions: Impressions represent the number of times your content has been displayed in search results. A high number of impressions with low clicks might indicate that your content is being seen but not attracting users to click through.
-
Average CTR (Click-Through Rate): CTR is a vital metric that shows the percentage of users who click on your content after seeing it in search results. A higher CTR generally means your content is more compelling and relevant to the searcher's intent.
-
Average Position: This metric shows the average position of your content in search results. Higher positions usually lead to more visibility and, consequently, more clicks and impressions.
Analyzing Trends Over Time
One of the most valuable features of a data analytics dashboard is the ability to visualize trends over time. Line graphs that illustrate the performance of clicks and impressions can provide deeper insights into the effectiveness of your SEO strategies. For example, a dashboard showing metrics from June 9, 2021, to June 30, 2022, might reveal seasonal trends, the impact of specific campaigns, or the effects of algorithm updates. This historical data can guide future strategies and help predict potential outcomes.
Another example from April 14, 2024, to March 30, 2025, might show different trends, highlighting the importance of continuous monitoring and adaptation. Recognizing patterns and anomalies in these trends can help you adjust your approach to stay ahead of the competition.
Case Studies and Real-World Success
A powerful way to understand the impact of effective SEO strategies is through case studies. For instance, a top case study might have generated 1.7 million+ organic clicks. This level of success is not achieved through gimmicks or AI-generated backlinks but through a clean strategy, strong execution, and ruthless consistency. Analyzing such case studies can provide practical insights into what works and what doesn't in the SEO landscape.
The Dream SEO Masterclass
The ongoing Dream SEO Masterclass is an excellent example of how practical strategies can be applied in the real world. Hosted by Hostinger, this masterclass includes five live sessions designed to upskill participants in effective SEO strategies. Over 200 people have already benefited from these sessions, gaining the knowledge and tools needed to succeed in the field. The masterclass emphasizes the importance of consistency and strong execution, which are key to achieving real results in SEO.
Practical Tips
Consistency is Key
One of the most important takeaways from successful SEO case studies is the importance of consistency. Consistent effort in creating high-quality content, optimizing for search engines, and building quality backlinks can lead to significant long-term benefits. Consistency ensures that your SEO strategies are continuously refined and adapted to achieve the best possible results.
Focus on Quality Over Quantity
While the number of clicks and impressions is important, the quality of traffic is equally crucial. Strategies that focus on attracting relevant, high-quality traffic are more likely to yield better results. This means creating content that genuinely meets the needs and interests of your target audience.
Monitor and Adapt
Regularly monitoring your SEO performance metrics and adapting your strategies based on the data is essential. Use the insights gained from your data analytics dashboard to make informed decisions. This ongoing process of monitoring and adaptation can help you stay ahead of the curve and achieve sustained success in your SEO efforts.
Use a Data Analytics Dashboard
A comprehensive data analytics dashboard can provide you with the insights you need to make informed decisions. By regularly reviewing metrics like clicks, impressions, CTR, and position, you can identify areas for improvement and optimize your strategies accordingly.
Important Takeaways
- Data-Driven Decisions: Use a comprehensive data analytics dashboard to track key metrics and make informed decisions.
- Consistency and Quality: Focus on consistent, high-quality SEO strategies to achieve long-term success.
- Continuous Monitoring: Regularly monitor your performance metrics and adapt your strategies as needed.
- Real-World Application: Apply the concepts learned in SEO masterclasses like the Dream SEO Masterclass to see practical results.
Conclusion
In the dynamic world of SEO, success is often determined by how well you understand and utilize data analytics. A well-designed data analytics dashboard can provide the insights you need to optimize your strategies, track your performance, and achieve your SEO goals. By focusing on consistency, quality, and continuous monitoring, you can succeed in this competitive field and make a significant impact in your digital marketing efforts.
Watch the Reel
Questions readers ask
What are the key metrics to track for SEO performance?
The key metrics to track in an SEO analytics dashboard include total clicks, impressions, click-through rate (CTR), and search position. These metrics offer a comprehensive view of how your SEO strategies are performing and where improvements can be made.
How can a data analytics dashboard help optimize my SEO strategy?
A data analytics dashboard provides a central hub for visualizing and analyzing SEO metrics. By tracking metrics like CTR and search position, you can identify trends, pinpoint areas for improvement, and make data-informed adjustments to your SEO strategies.
What is the significance of tracking total clicks and impressions in SEO?
Tracking total clicks and impressions helps you understand how often your web pages appear in search results and how frequently users interact with those results. This information is crucial for assessing the visibility and effectiveness of your SEO efforts.
How does click-through rate (CTR) impact SEO performance?
Click-through rate (CTR) is a critical metric because it indicates how compelling your search listings are to users. A higher CTR suggests that your titles and meta descriptions are effectively encouraging users to click through to your site, which can positively impact your search rankings.
Why is monitoring search position important for SEO?
Monitoring search position helps you understand where your web pages rank for specific keywords. This metric is essential for gauging the effectiveness of your keyword strategy and for identifying opportunities to improve your rankings and drive more organic traffic.
What are some best practices for using an SEO dashboard?
To get the most out of an SEO dashboard, regularly review your key metrics, set up custom alerts for significant changes, and use the data to inform your optimization efforts. Additionally, compare your performance over time to identify trends and make strategic adjustments.
Can an SEO dashboard help identify trends in my search traffic?
Yes, an SEO dashboard can help identify trends by providing historical data and visualization tools. By analyzing these trends, you can understand seasonal fluctuations, the impact of algorithm updates, and the effectiveness of your SEO campaigns over time.
Recent articles
Fresh deep dives from the latest Reels we unpacked.




Comments
Be the first to comment.