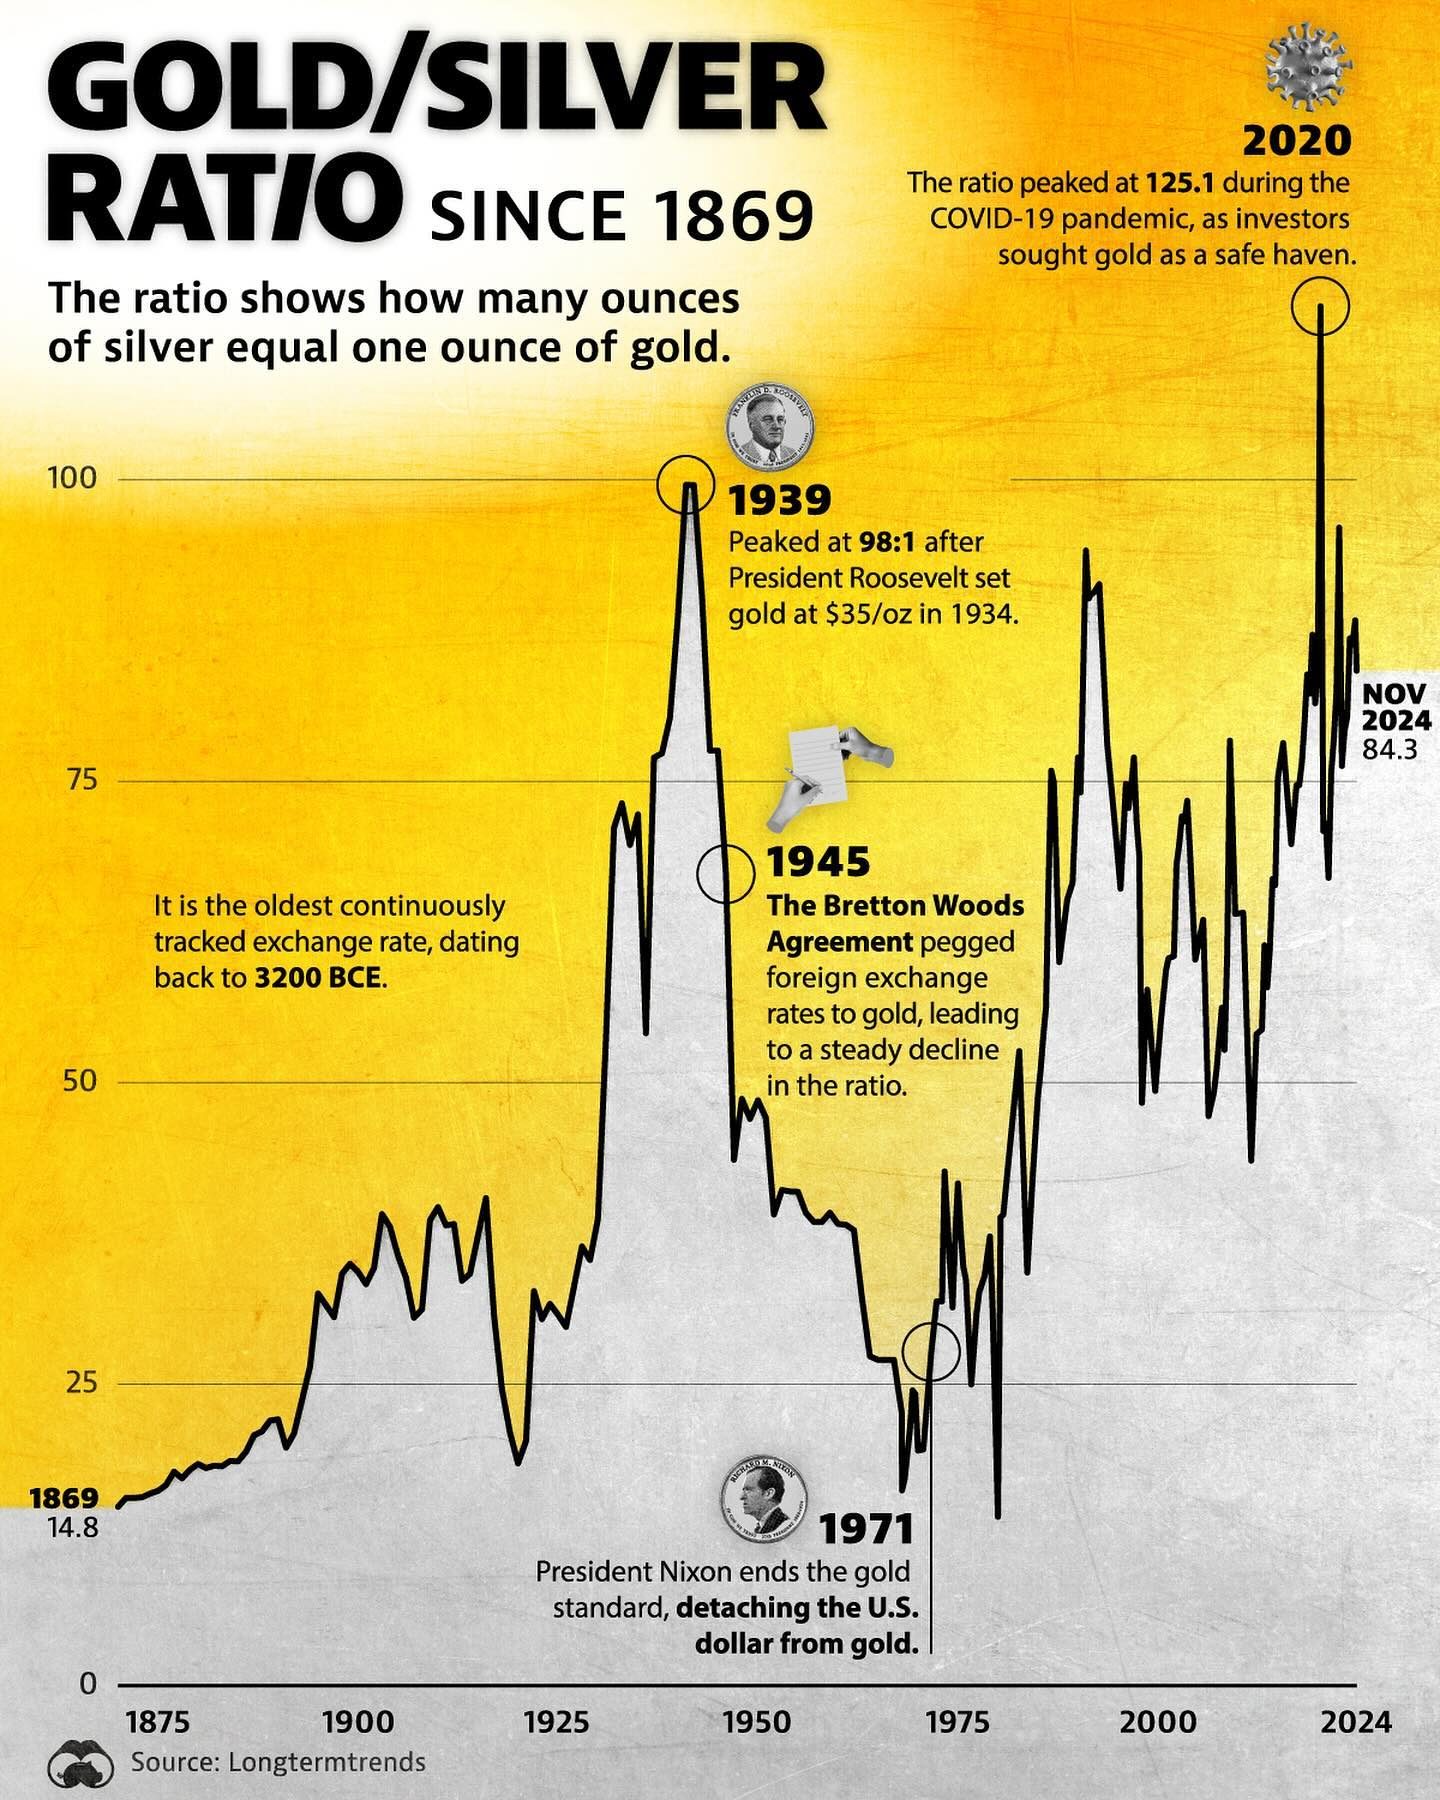
The gold-to-silver ratio is a fascinating and historically significant metric that has been tracked for thousands of years. Currently, the ratio stands at 84.5, after reaching a peak of 125.1 during the COVID-19 pandemic. This ratio, which measures how many ounces of silver are needed to purchase one ounce of gold, dates back to 3200 BCE, making it the oldest continuously tracked exchange rate.
Context / Why this matters
Understanding the gold-to-silver ratio is crucial for investors and economists alike. Gold and silver have long been considered safe-haven assets, and their relative value can provide insights into market sentiment, inflation expectations, and global economic trends. By examining the historical fluctuations of this ratio, we can gain a better understanding of broader economic patterns and how they have evolved over time.
Main discussion
Historical overview
The gold-to-silver ratio has seen significant fluctuations over the centuries. One of the most notable historical events affecting the ratio was President Roosevelt's decision to set the gold price at $35 per ounce in 1934. This move led to a peak in the ratio of 98:1 in 1939, as the value of gold relative to silver increased. This period was marked by economic turmoil and efforts to stabilize the U.S. economy through monetary policy changes.
The Bretton Woods Agreement
Another pivotal moment occurred in 1945 with the Bretton Woods Agreement. This international monetary agreement pegged foreign exchange rates to the U.S. dollar, which in turn was linked to gold. This policy led to a steady decline in the gold-to-silver ratio as the global economy sought stability and predictability in exchange rates.
The end of the gold standard
In 1971, President Nixon ended the gold standard, detaching the U.S. dollar from gold. This move had far-reaching implications for the global economy and the gold-to-silver ratio. The detachment allowed for more flexible monetary policies, but it also introduced volatility into the markets. The gold-to-silver ratio began to fluctuate more widely, reflecting the increased uncertainty and changing economic conditions.
Recent trends and the COVID-19 pandemic
The COVID-19 pandemic brought about another significant peak in the gold-to-silver ratio, reaching 125.1 as investors sought the safety and stability of gold. The pandemic-induced economic uncertainty and market volatility drove up the demand for gold, leading to a sharp increase in its value relative to silver. This trend highlights the enduring role of gold as a safe-haven asset during times of crisis.
Key events and their impacts
- 1934: President Roosevelt set the gold price at $35 per ounce, leading to a peak in the ratio at 98:1 in 1939.
- 1945: The Bretton Woods Agreement established a fixed exchange rate system, pegging currencies to the U.S. dollar, which was backed by gold. This led to a steady decline in the ratio.
- 1971: President Nixon ended the gold standard, introducing greater volatility in the markets and impactful changes to the gold-to-silver ratio.
- 2020: The COVID-19 pandemic caused the ratio to peak at 125.1 as investors flocked to gold for its safe-haven status.
Practical tips
Investors interested in the gold-to-silver ratio can use it as a tool for making informed decisions. Here are some practical tips:
- Monitor the ratio: Keep an eye on the gold-to-silver ratio to gauge market sentiment and economic trends. A rising ratio might indicate increasing uncertainty or a flight to safety, while a falling ratio could suggest greater confidence in the economy.
- Diversify your portfolio: Consider holding both gold and silver in your investment portfolio. This strategy can help hedge against market volatility and provide a balanced approach to precious metals investing.
- Stay informed: Stay updated on global economic events and policies that could impact the gold-to-silver ratio. Historical events like the Bretton Woods Agreement and the end of the gold standard have shown that significant shifts in policy can have lasting effects on the ratio.
Important takeaways
- The gold-to-silver ratio is the oldest continuously tracked exchange rate, providing a historical perspective on economic trends.
- Key events like the Bretton Woods Agreement and the end of the gold standard have significantly impacted the ratio.
- The COVID-19 pandemic led to a peak in the ratio, highlighting gold's role as a safe-haven asset during times of crisis.
- The ratio can serve as a valuable tool for investors looking to understand market sentiment and economic conditions.
Conclusion
The gold-to-silver ratio offers a unique lens through which to view economic history and current market trends. By understanding its fluctuations and the events that have shaped it, investors can gain valuable insights into the broader economic landscape. Whether you're a seasoned investor or new to the world of precious metals, keeping an eye on the gold-to-silver ratio can provide a deeper understanding of the forces shaping our economy today.
Watch the Reel
Questions readers ask
What is the current gold-to-silver ratio and how does it compare to historical levels?
As of the latest data, the gold-to-silver ratio stands at 84.5. This value is significantly lower than the peak of 125.1 observed during the COVID-19 pandemic. Historically, the ratio has fluctuated widely, reflecting various economic conditions and market sentiments. The gold to silver ratio 1869 was much different, showing how the ratio can change dramatically over time.
How has the gold-to-silver ratio served as an economic indicator throughout history?
The gold-to-silver ratio has been a reliable economic indicator for centuries. Its fluctuations have often mirrored periods of prosperity and economic turmoil. For instance, during times of high inflation or market uncertainty, the ratio tends to rise as investors seek the relative safety and stability of gold. Conversely, when economic conditions are stable and investors are more confident, the ratio tends to decrease.
What was the gold-to-silver ratio during significant historical events, such as the COVID-19 pandemic?
During the COVID-19 pandemic, the gold-to-silver ratio reached an all-time high of 125.1. This spike reflected the heightened market uncertainty and economic instability caused by the global health crisis. Investors flocked to gold as a safe-haven asset, driving up its price relative to silver.
Why is the gold-to-silver ratio considered the oldest continuously tracked exchange rate?
The gold-to-silver ratio is considered the oldest continuously tracked exchange rate because it dates back to ancient civilizations, with records starting as early as 3200 BCE. This long history provides a unique perspective on economic trends and market behaviors over millennia, offering insights into global economic patterns and market sentiments.
How can investors use the gold-to-silver ratio to inform their strategies?
Investors can use the gold-to-silver ratio to gauge market sentiment and make informed decisions. A high ratio may indicate that silver is undervalued relative to gold, presenting a buying opportunity. Conversely, a low ratio might suggest that gold is overvalued. Additionally, the ratio can provide insights into inflation expectations and broader economic trends, helping investors to diversify their portfolios effectively.
Related deep dives
Similar reads based on topic and creator.




Recent articles
Fresh deep dives from the latest Reels we unpacked.




Comments
Be the first to comment.