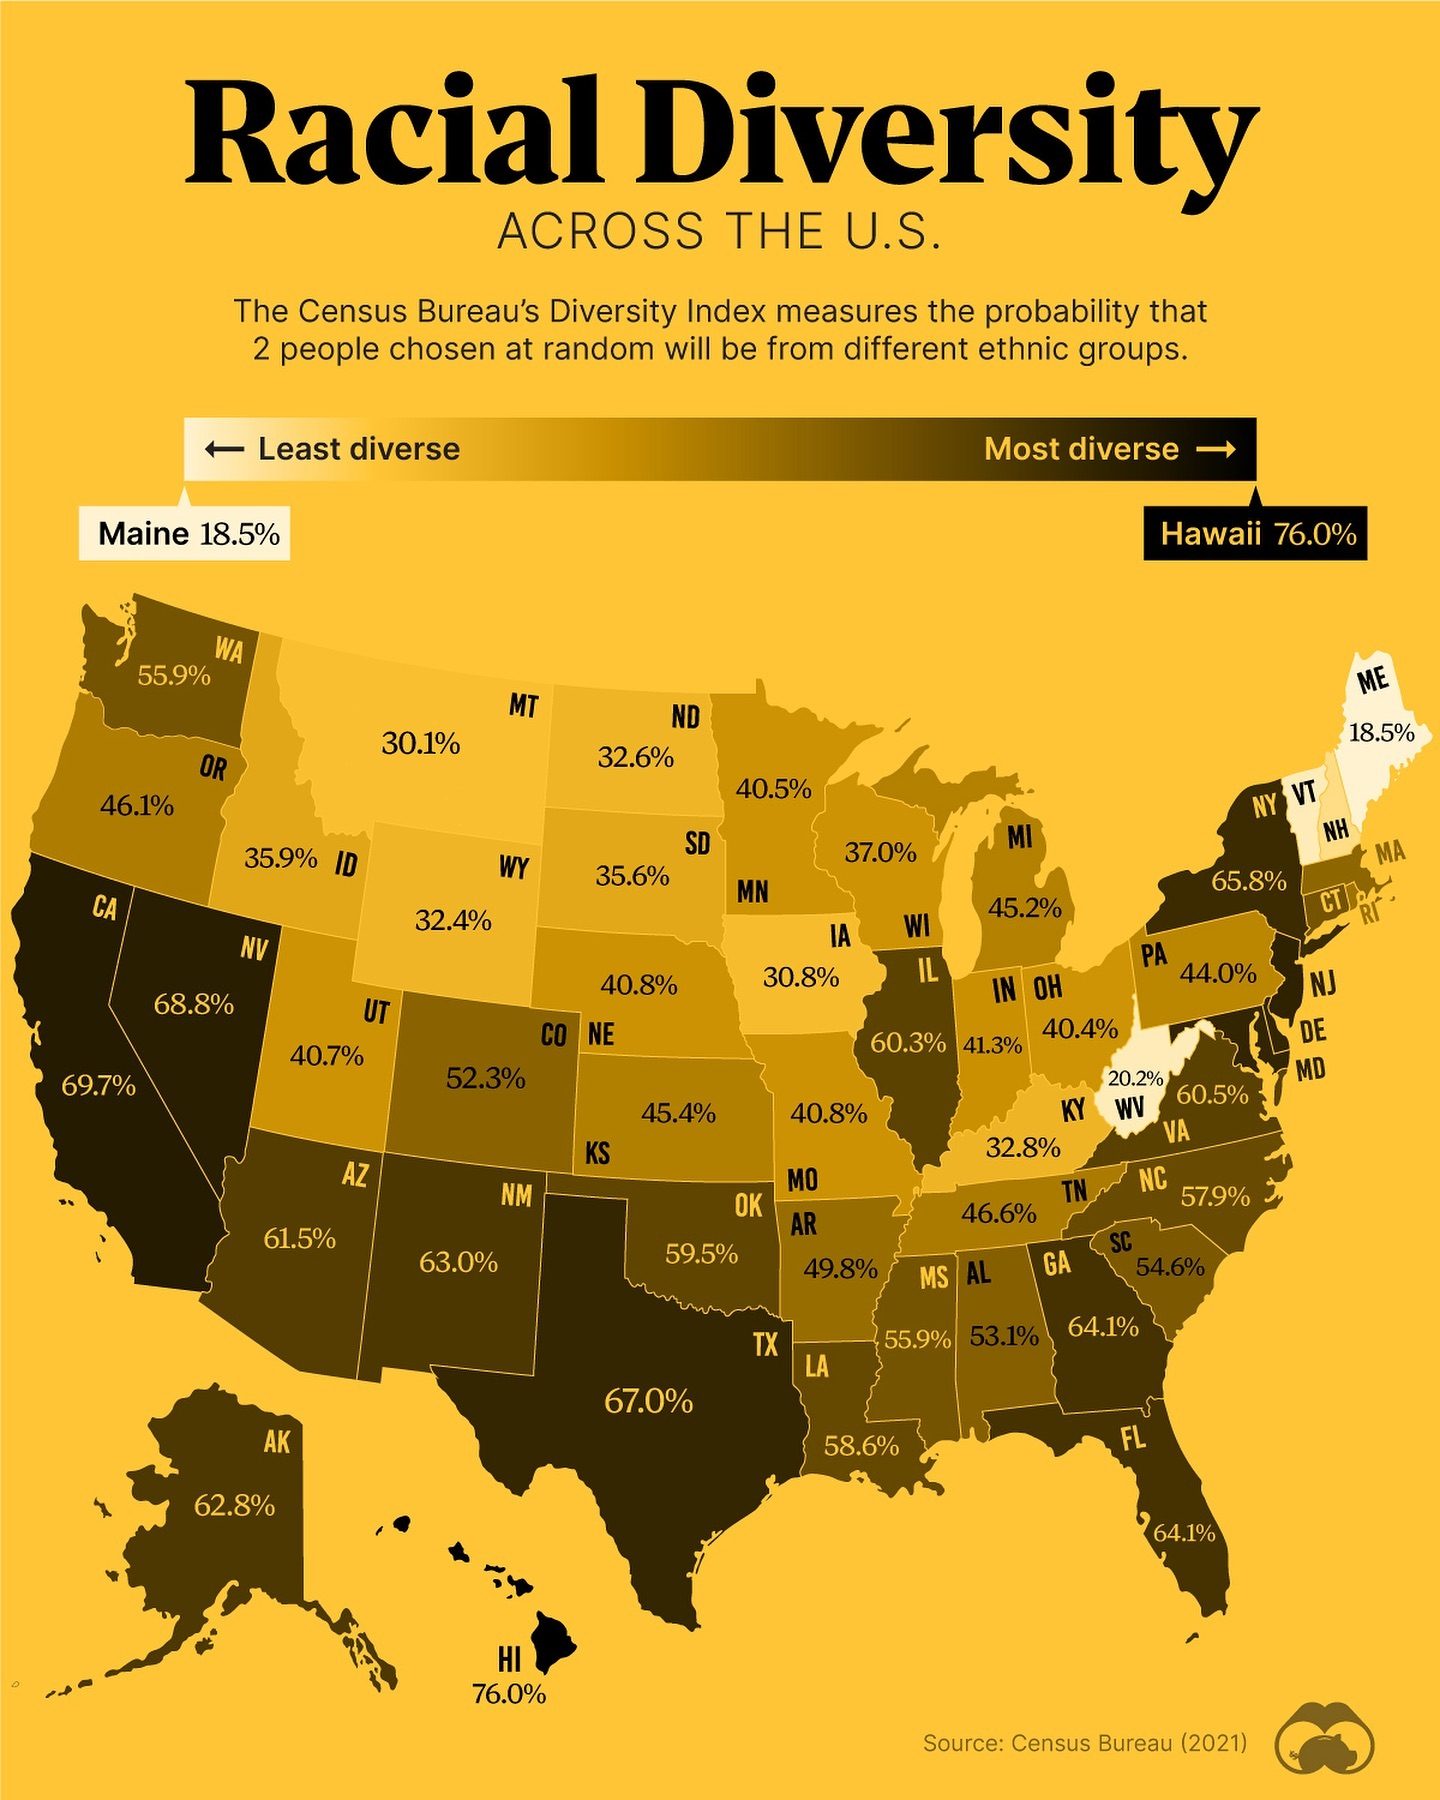
Racial Diversity in the U.S.
The United States is a nation of diverse ethnicities, with a racial diversity index that provides a quantitative measure of this diversity. As of 2020, there was a 61.1% likelihood that two people chosen at random in the U.S. would be from different ethnic groups. This index is derived from the Census Bureau's Diversity Index, which ranges from 0% to 100% per jurisdiction. A value closer to 0% indicates a more homogenous population, while a value closer to 100% signifies greater racial diversity.
Why This Matters
Understanding racial diversity in the U.S. is crucial for various reasons. It helps in shaping policies, promoting social cohesion, and addressing issues of equality and inclusion. The Census Bureau's Diversity Index provides a comprehensive view of how diverse the population is at a local level, which can inform urban planning, education, healthcare, and other public services.
Main Discussion
The Diversity Index Explained
The Census Bureau's Diversity Index is a valuable tool for measuring racial diversity. It calculates the probability that two randomly selected people from a given area will be from different ethnic or racial groups. This index is calculated for various jurisdictions, including states, counties, and even smaller areas.
How the Index Works
The index ranges from 0 to 100. A value of 0% indicates that the population is entirely homogenous, meaning everyone in the area belongs to the same ethnic group. A value of 100% indicates that the population is maximally diverse, with an equal representation of all ethnic groups. For example, a state with a Diversity Index of 50% has a 50% chance that two randomly chosen individuals will be from different ethnic groups.
Most and Least Diverse States
The visual representation of the Diversity Index across the U.S. reveals significant variations in racial diversity among states. Some states stand out for their high levels of diversity, while others are more homogenous.
Most Diverse States
-
Hawaii (76.0%): Hawaii is the most diverse state in the U.S., with a Diversity Index of 76.0%. This high level of diversity is due to its rich ethnic mix, which includes significant populations of Native Hawaiians, Asians, Pacific Islanders, and Caucasians.
-
California (70.7%) : California follows closely with a Diversity Index of 70.7%. The state is known for its multicultural population, influenced by its coastal location and long history of immigration.
-
Nevada (68.6%) : Nevada has a Diversity Index of 68.6%, reflecting its diverse population, especially in urban areas like Las Vegas and Reno, which attract people from various backgrounds.
Least Diverse States
-
Maine (18.5%) : Maine is the least diverse state in the U.S. with a Diversity Index of 18.5%. The state's population is predominantly white, with smaller populations of African Americans, Asians, and Hispanics.
-
West Virginia (21.2%) : West Virginia has a Diversity Index of 21.2%, indicating a relatively homogenous population. The state's population is predominantly white, with smaller percentages of African Americans, Asians, and other ethnic groups.
-
Vermont (22.5%) : Vermont has a Diversity Index of 22.5%, reflecting its predominantly white population. Like Maine and West Virginia, Vermont has smaller percentages of other ethnic groups.
Practical Tips
For those interested in understanding and promoting racial diversity, here are some practical tips:
-
Engage with Local Data: Use local diversity data to understand the demographic composition of your community. This can help in planning community events, educational programs, and public services that cater to a diverse population.
-
Promote Inclusive Policies: Advocate for policies that promote equality and inclusion. This can include measures to reduce discrimination, provide equal access to opportunities, and foster a sense of belonging among all residents.
-
Celebrate Cultural Diversity: Organize events and activities that celebrate cultural diversity. This can help in fostering a sense of unity and understanding among different ethnic groups.
-
Educate Yourself and Others: Learn about different cultures and ethnicities. This can help in breaking down stereotypes and misconceptions, and promoting a more inclusive society.
Important Takeaways
-
The Census Bureau's Diversity Index provides a valuable measure of racial diversity, helping us understand the demographic composition of different jurisdictions.
-
States like Hawaii, California, and Nevada have high levels of racial diversity, while states like Maine, West Virginia, and Vermont are more homogenous.
-
Engaging with local data, promoting inclusive policies, celebrating cultural diversity, and educating oneself and others are practical steps to understanding and promoting racial diversity.
Conclusion
Racial diversity in the U.S. is a complex and dynamic phenomenon. The Census Bureau's Diversity Index offers a quantitative measure of this diversity, providing valuable insights into the demographic composition of different jurisdictions. Understanding and promoting racial diversity is essential for fostering a more inclusive and cohesive society. By engaging with local data, promoting inclusive policies, celebrating cultural diversity, and educating ourselves and others, we can contribute to a more diverse and equal society.
Watch the Reel
Questions readers ask
Which states are considered the most racially diverse in the U.S.?
The most racially diverse states in the U.S. are typically those with high scores on the Census Bureau's Diversity Index. As of recent data, Hawaii, California, and New York often top the list due to their large immigrant populations and historical settlement patterns. These states have a high likelihood of randomly selected individuals being from different ethnic groups.
Where can I find the most recent racial diversity statistics for each state?
The most recent and detailed racial diversity statistics for each state can be found on the U.S. Census Bureau's website. They provide a comprehensive Diversity Index that breaks down the racial and ethnic composition of each state, offering a clear picture of the population's diversity. Various other demographic statistics are also available, and can be used to analyze specific trends in diversity across the nation.
What factors contribute to the differences in racial demographics by state?
Several factors contribute to the differences in racial demographics by state, including historical settlement patterns, immigration trends, and economic opportunities. States with large metropolitan areas, such as California and New York, tend to have higher racial diversity due to their attractiveness to immigrants and a broader range of job opportunities. Conversely, states with smaller, more rural populations, like West Virginia and Vermont, may have more homogenous populations.
How is the U.S. Diversity Index calculated?
The U.S. Diversity Index is calculated using data from the U.S. Census Bureau, which takes into account the racial and ethnic composition of each jurisdiction from the most recent census. The index provides a percentage indicating the probability that two randomly chosen individuals from a given area will be from different ethnic groups. A higher percentage signifies greater diversity, while a lower percentage indicates a more homogeneous population.
What insights can be gained from understanding state-by-state racial diversity?
Understanding state-by-state racial diversity offers valuable insights into the social, economic, and political dynamics of the U.S. This information can help inform policy decisions, promote social cohesion, and identify areas that may need targeted support for equality and inclusion. For instance, states with greater diversity may require more resources for language services or cultural sensitivity training, while less diverse states may need initiatives to foster multicultural understanding.
Related deep dives
Similar reads based on topic and creator.

Recent articles
Fresh deep dives from the latest Reels we unpacked.




Comments
Be the first to comment.