iOS Simulator Debugging
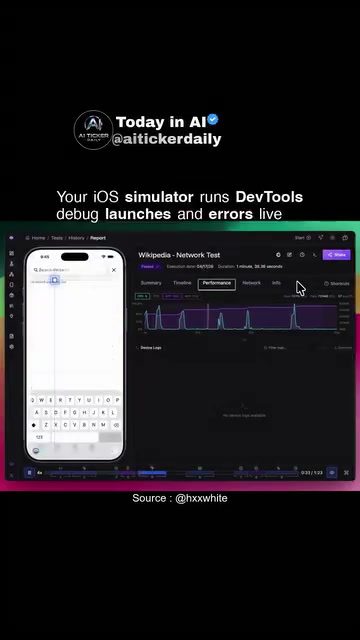
iOS simulators are invaluable tools for developers, allowing them to test their applications on virtual devices without the need for physical hardware. They help identify and resolve issues before the app is deployed to real devices. Integrating Chrome DevTools-style inspection into the iOS Simulator, as highlighted in a recent project by Hayden, takes this capability a step further by providing real-time performance, networking, and log data directly within the simulator.
Why This Matters
Debugging is a critical aspect of software development, and having access to detailed performance and networking data can significantly accelerate the development process. By integrating DevTools into the iOS Simulator, developers can debug their apps in a more efficient and effective manner. This integration allows them to see slow launches, failing requests, and errors directly in the test output, much like they would when debugging web applications.
Main Discussion
iOS Simulator
An iOS simulator is a virtual device that runs on a developer's computer, mimicking the behavior of real iOS devices. This allows developers to test their apps in a controlled environment, ensuring compatibility and performance across different iOS versions and device types. The simulator supports a wide range of iOS devices and can be configured to simulate various hardware capabilities, such as camera, GPS, and network conditions.
Chrome DevTools
Chrome DevTools is a set of web developer tools built directly into the Google Chrome browser. It provides a suite of features for debugging, profiling, and optimizing web applications. These tools include performance monitoring, network analysis, and detailed logging, which are incredibly useful for identifying and fixing issues in web apps.
Integration of DevTools into iOS Simulator
Hayden’s project wires Chrome DevTools-style inspection into the iOS Simulator, allowing developers to see performance, networking, and logs in real-time. This integration is particularly beneficial for debugging slow launches, failing requests, and errors. By surfacing these issues directly in the test output, developers can quickly identify and resolve problems, making the debugging process more efficient.
Performance Monitoring
One of the key features of this integration is the ability to monitor application performance in real-time. The simulator can display various metrics, such as execution time, device logs, and network requests. This data is crucial for identifying performance bottlenecks and optimizing the app to run more smoothly. By having access to this information directly within the simulator, developers can make informed decisions about where to focus their optimization efforts.
Network Testing
Network testing is another critical aspect of app development. The iOS Simulator can help identify performance bottlenecks and issues with network requests by simulating different network conditions. By running a network test, such as the one shown on Wikipedia, developers can see detailed information about the network requests made by their app, including response times, request sizes, and error codes. This information can help them optimize their app’s network performance and ensure it runs smoothly under various conditions.
Error Reporting
Error reporting is a crucial part of debugging, and the integration of DevTools into the iOS Simulator makes it easier to identify and resolve errors. By surfacing errors directly in the test output, developers can quickly pinpoint the source of the issue and make the necessary fixes. This real-time error reporting helps to streamline the debugging process and reduce the time it takes to resolve issues.
Practical Tips
When using the iOS Simulator for debugging, it's important to make the most of the available tools and features. Here are some practical tips to help you get the most out of your debugging sessions:
-
Configure the Simulator Appropriately: Make sure the simulator is configured to mimic the conditions of the target device as closely as possible. This includes setting the correct iOS version, device type, and network conditions.
-
Use Breakpoints Effectively: Breakpoints are a powerful tool for debugging, allowing you to pause the execution of your code and inspect the state of your app. Use them strategically to identify and resolve issues.
-
Monitor Performance Metrics: Keep an eye on the performance metrics provided by the simulator, such as execution time and device logs. Use this information to identify performance bottlenecks and optimize your app accordingly.
-
Analyze Network Requests: Use the network testing features to analyze the network requests made by your app. Look for slow response times, failed requests, and other issues that could impact the user experience.
-
Review Logs Regularly: Regularly review the logs generated by the simulator to identify any errors or warnings that could indicate problems with your app. Address these issues promptly to ensure a smooth user experience.
Important Takeaways
- Real-time Debugging: The integration of Chrome DevTools-style inspection into the iOS Simulator allows for real-time debugging, making it easier to identify and resolve issues.
- Performance Monitoring: The simulator provides valuable performance metrics, such as execution time and device logs, which can help optimize app performance.
- Network Testing: Running network tests within the simulator can help identify performance bottlenecks and issues with network requests.
- Error Reporting: By surfacing errors directly in the test output, developers can quickly pinpoint and resolve issues, streamlining the debugging process.
- Efficient Development: The combination of these features makes the iOS Simulator a powerful tool for efficient and effective app development, helping developers deliver high-quality apps.
Conclusion
Integrating Chrome DevTools-style inspection into the iOS Simulator is a game-changer for developers. It provides real-time performance, networking, and log data directly within the simulator, making it easier to identify and resolve issues. By leveraging these tools, developers can optimize their apps for better performance, reliability, and user experience. Whether you're a seasoned developer or just starting out, taking advantage of these features can significantly enhance your development process and help you deliver high-quality apps.
Watch the Reel
Questions readers ask
What are the benefits of using Chrome DevTools in the iOS Simulator?
Using Chrome DevTools in the iOS Simulator allows developers to access real-time performance data, network request details, and error logs, all in one place. This integration streamlines the debugging process, making it faster and more efficient to identify and fix issues in iOS apps.
How do I start using Chrome DevTools with the iOS Simulator?
To begin, ensure you have the latest iOS Simulator and Xcode installed. Then, set up your project to support web inspection. Finally, connect the simulator to Chrome DevTools by enabling the necessary options in Safari and opening the DevTools interface.
Can I debug network requests using Chrome DevTools in the iOS Simulator?
Yes, Chrome DevTools in the iOS Simulator provides comprehensive network request debugging. You can monitor all network requests made by your app, view request and response headers, inspect payloads, and analyze loading times to identify performance bottlenecks.
What kind of performance data can I access with this integration?
With Chrome DevTools integrated into the iOS Simulator, you can access detailed performance data, including CPU and memory usage, rendering times, and frame rates. This information helps in optimizing the app's performance and ensuring a smooth user experience.
How does real-time debugging in the iOS Simulator help developers?
Real-time debugging in the iOS Simulator allows developers to see immediate effects of their code changes, making the debugging process more interactive and efficient. This real-time feedback loop helps in quickly identifying and resolving issues, reducing the overall development time.
Can I view iOS app error logs using Chrome DevTools in the iOS Simulator?
Yes, you can view error logs generated by your iOS app. These logs are crucial for understanding and fixing bugs. By accessing error logs in real-time, developers can pinpoint the exact cause of issues and implement fixes more effectively.
Is there a way to test iOS app performance on different devices using the iOS Simulator with Chrome DevTools?
Yes, the iOS Simulator supports a variety of virtual devices with different screen sizes, resolutions, and hardware capabilities. By testing your app on these different devices, you can ensure consistent performance and user experience across all supported iOS devices. Chrome DevTools will provide the necessary performance data for each device configuration.
Recent articles
Fresh deep dives from the latest Reels we unpacked.




Comments
Be the first to comment.