U.S. Imports Over Time
U.S. imports have been a critical component of the American economy, reaching nearly $2 trillion by the second quarter of 2023. Understanding the dynamics of U.S. trade involves examining the key trading partners and the factors that have influenced their import shares over time.
Why This Matters
The U.S. is the world's largest economy, and its import patterns reflect global trade dynamics. By examining the top trading partners and the products they ship, we gain insights into economic trends, policy impacts, and market shifts. This analysis helps businesses, policymakers, and consumers understand the forces shaping the global market.
Key Trading Partners and Their Shifts
Mexico
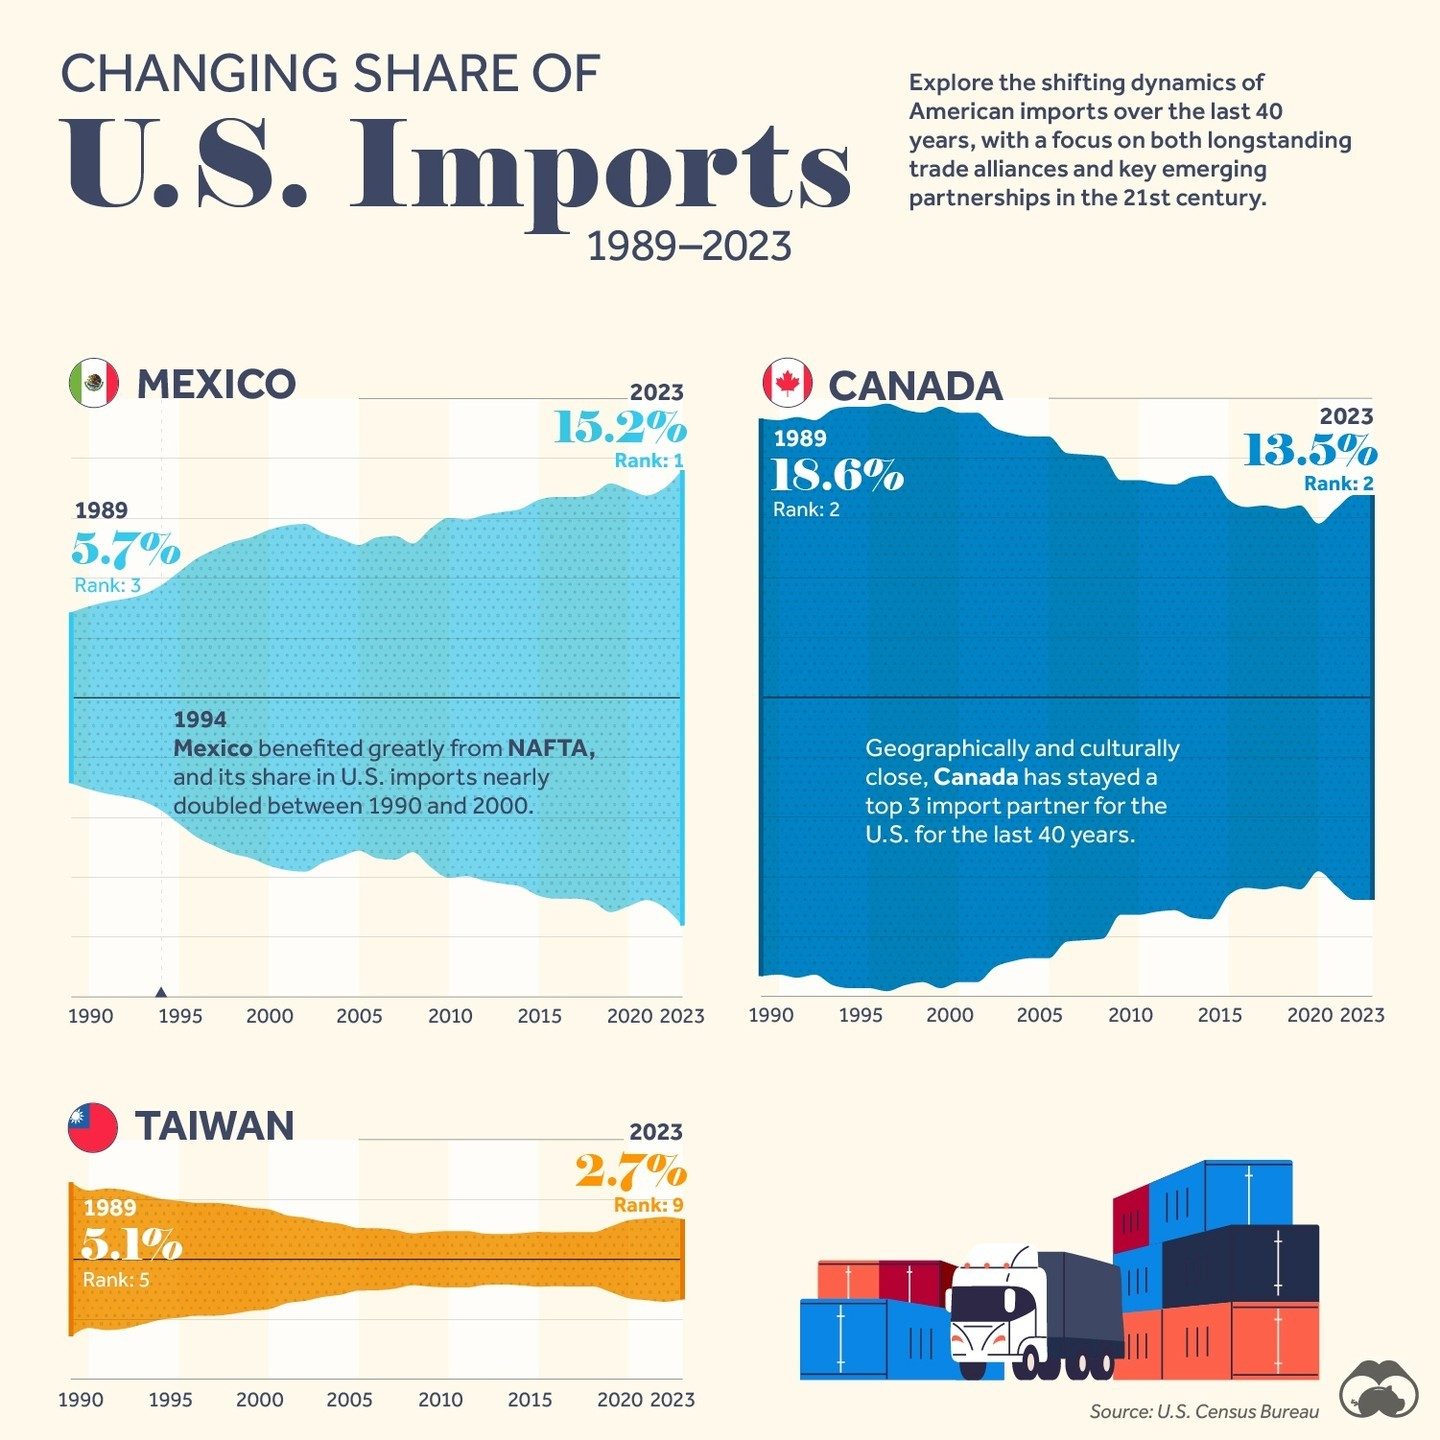
Mexico has consistently been a top trading partner for the U.S. Between 1990 and 2000, Mexico’s import share nearly doubled. This surge can be attributed to the North American Free Trade Agreement (NAFTA), which facilitated easier trade between the U.S., Canada, and Mexico. Mexico’s import share peaked in 2023 at 15.2%, making it the top trading partner for the U.S.
Canada
Canada has remained a steadfast trading partner, consistently ranking within the top three. In 2023, Canada held a 13.5% import share. The stable trading relationship is bolstered by NAFTA and the subsequent United States–Mexico–Canada Agreement (USMCA), which have fostered strong economic ties.
China
China's import share has seen significant fluctuations. It peaked in 2017 before declining slightly. In 2023, China held a 13.2% import share, ranking it as the third-largest trading partner. This volatility reflects broader geopolitical and economic shifts, including trade wars and policy changes.
Japan
Japan's import share has steadily decreased over the years as China has emerged as a global export powerhouse. In 2023, Japan held a 4.6% import share, ranking fifth. This decline is partly due to the shifting global manufacturing landscape and the rise of other Asian economies.
Taiwan, Vietnam, and India
Taiwan, Vietnam, and India have seen varying levels of growth in their import shares. In 2023, Taiwan held a 2.7% share, Vietnam 3.5%, and India 2.7%. These countries have benefited from global supply chain diversification and have become important sources of goods for the U.S. market.
Emerging Trends
Several emerging trends have influenced the shifting dynamics of U.S. imports. One notable trend is the diversification of supply chains, driven by geopolitical tensions and the need for resilience. This has led to increased imports from countries like Vietnam and India. Additionally, technological advancements and changing consumer preferences have altered the types of goods imported.
Practical Tips for Understanding Trade Data
Analyzing Import Shares
To understand import shares, it's crucial to look at the specific products being imported. For example, Mexico's high import share is largely due to manufactured goods and automotive parts, while China's share includes a wide range of consumer electronics and machinery.
Tracking Policy Changes
Policy changes, such as trade agreements and tariffs, can significantly impact import patterns. Staying informed about these changes can help businesses anticipate shifts in the market and adapt their strategies accordingly.
Monitoring Economic Indicators
Economic indicators, such as GDP growth and exchange rates, provide valuable context for understanding import trends. For instance, a strong U.S. economy can lead to increased imports, while economic downturns may result in decreased demand.
Important Takeaways
- Mexico, Canada, and China remain the top trading partners for the U.S., with significant import shares.
- Trade agreements like NAFTA and USMCA have played a crucial role in shaping trade dynamics.
- Supply chain diversification and technological advancements are driving shifts in import patterns.
- Policy changes and economic indicators are essential for understanding and predicting import trends.
Conclusion
U.S. imports have evolved significantly over the past four decades, reflecting a complex interplay of economic, political, and technological factors. By understanding the key trading partners and the forces influencing their import shares, we gain valuable insights into the dynamics of global trade. This knowledge is essential for businesses, policymakers, and consumers navigating the ever-changing landscape of international commerce.
Watch the Reel
Questions readers ask
Who are the top three U.S. trading partners today, and how has this changed since 1989?
The top three U.S. trading partners in 2023 are Mexico, Canada, and China. Since 1989, there has been a significant shift, with China emerging as a major player in U.S. trade, while Japan, which was previously a leading partner, has seen its share decrease.
What role have trade agreements played in shaping U.S. import trends?
Trade agreements have significantly influenced U.S. import trends. Agreements like NAFTA (now USMCA) with Mexico and Canada, and bilateral agreements with China, have lowered trade barriers, increased market access, and fostered economic integration.
Which U.S. trade partners have seen the most significant shifts in their import shares since 1989?
Mexico and China have seen the most substantial shifts in their import shares. Mexico's proximity and trade agreements have made it a consistent and growing partner, while China's rapid economic growth and manufacturing capabilities have made it a dominant force in U.S. imports.
How have policy changes influenced U.S. trade dynamics with key partners?
Policy changes, such as tariff adjustments and shifts in trade agreements, have greatly impacted U.S. trade dynamics. For instance, changes in tariffs on steel and aluminum have affected trade with Canada and Mexico, while tariffs on Chinese goods have altered the import landscape.
How do U.S. import patterns reflect global trade dynamics?
U.S. import patterns mirror global trade dynamics by showcasing the rise and fall of key trading partners. For example, the increase in imports from Mexico and China reflects their growing economic power and manufacturing capabilities, while the decrease from Japan indicates shifts in global production.
What insights can businesses gain from understanding U.S. import trends?
Businesses can gain valuable insights into market opportunities and risks by understanding U.S. import trends. This knowledge helps in identifying new markets, understanding supply chain dynamics, and anticipating changes in demand for specific products.
How has the role of Japan as a U.S. trading partner evolved since 1989?
Japan's role as a U.S. trading partner has evolved significantly since 1989. While it was once a leading partner, its share in U.S. imports has decreased due to the rise of other economies, particularly China and Mexico. However, Japan remains an important trading partner, particularly in the automotive and technology sectors.
Recent articles
Fresh deep dives from the latest Reels we unpacked.




Comments
Be the first to comment.