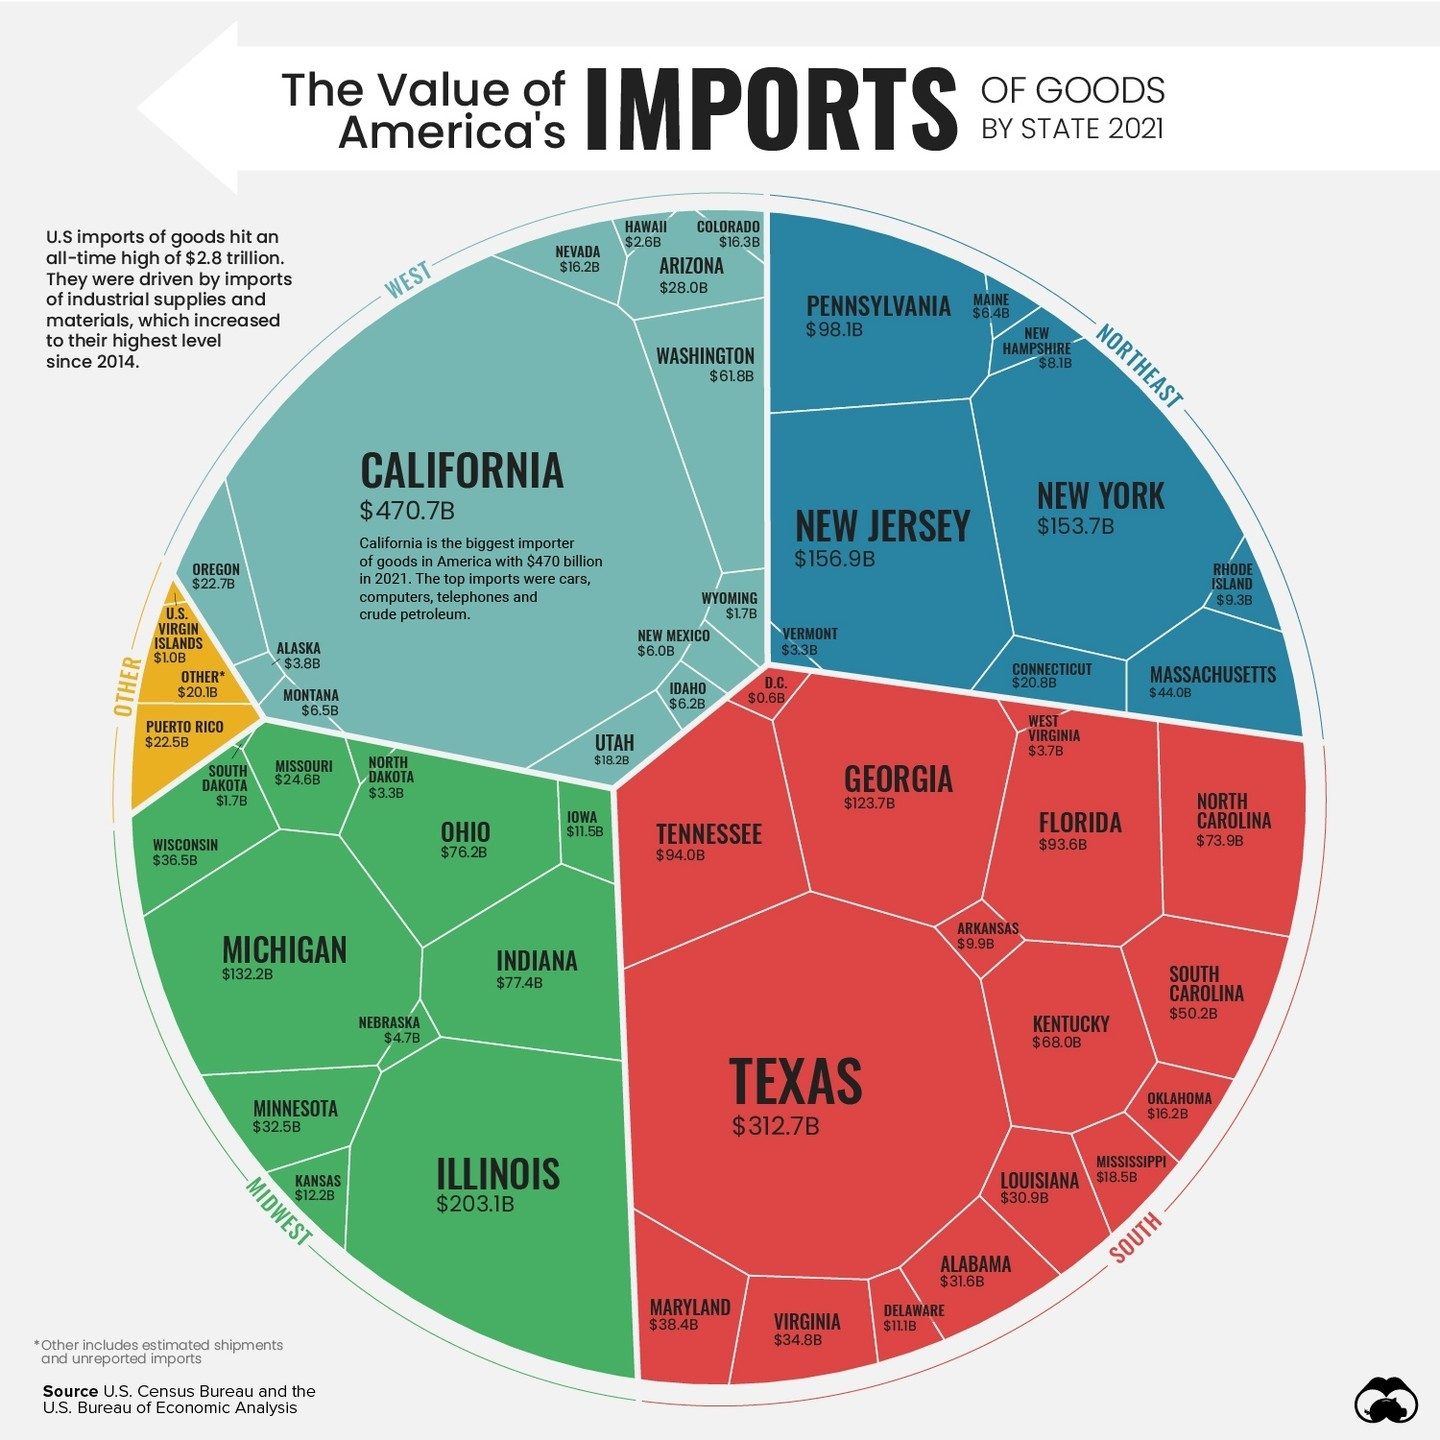
U.S. Imports by State: A Detailed Breakdown
The value of American imports of goods has seen a significant rise, reaching an unprecedented $2.8 trillion in 2021. This surge in imports has contributed to a record-high trade deficit of over a trillion dollars. To better understand this economic landscape, let’s explore the state-by-state distribution of these imports and the factors driving this trend.
Context/Why This Matters
Understanding the distribution of imports across different states provides insights into the economic activities and industrial demands in various regions. It highlights the importance of certain states in the U.S. economy and their reliance on imported goods. This information is critical for policymakers, businesses, and economists looking to make informed decisions about trade, investments, and economic policies.
Main Discussion
The Overall Import Trends
In 2021, the U.S. imported goods worth $2.8 trillion, marking an all-time high. This figure is driven primarily by the increased demand for industrial supplies and materials. The imports of these goods reached their highest level since 2014, underscoring the growing industrial activity and manufacturing needs in the country. This surge in imports has widened the goods trade deficit to its highest recorded level, standing at $1 trillion.
State-by-State Import Values
The distribution of imports varies significantly across different states. California leads the way with the highest import value of $470.7 billion, reflecting its robust economy and extensive industrial and commercial activities. Other states with substantial import values include:
- New Jersey: This state imported goods worth $153.7 billion, indicating a strong demand for industrial supplies and materials.
- Texas: With imports totaling $312.7 billion, Texas is a key player in the U.S. import market, driven by its diverse industrial sectors and logistics capabilities.
- Washington: This state imported goods valued at $61.6 billion, highlighting its industrial and technological needs.
- Illinois: Illinois imported goods worth $26.8 billion, showcasing its role in the national industrial landscape.
These figures illustrate the diverse economic activities and industrial demands across the country, with each state playing a unique role in the overall import ecosystem.
Key Imported Goods
The surge in imports is largely driven by the increased demand for industrial supplies and materials. This category includes raw materials, components, and other items essential for manufacturing and production processes. The rise in these imports suggests a growth in industrial activities and a robust manufacturing sector, which relies heavily on imported goods to meet production demands.
Practical Tips
To navigate the complexities of international trade, businesses and policymakers can consider the following practical tips:
- Stay Informed: Keep up-to-date with the latest trade data and economic trends to make informed decisions regarding imports and exports.
- Diversify Suppliers: Diversifying the supply chain can mitigate risks associated with over-reliance on imported goods from specific regions or countries.
- Invest in Local Production: Encouraging local production can reduce dependency on imports and support domestic industries.
- Policy Collaboration: Work collaboratively with policymakers to develop trade policies that balance domestic production and import needs.
Important Takeaways
The analysis of U.S. imports by state provides several important takeaways:
- California's Dominance: California’s significant import value underscores its pivotal role in the U.S. economy, driven by its diverse industrial and commercial activities.
- Industrial Supplies: The surge in imports, particularly in industrial supplies and materials, reflects a growing industrial sector and increased manufacturing activities.
- Regional Differences: The variations in import values across states highlight the unique economic activities and industrial demands in each region, emphasizing the importance of tailored economic policies.
Conclusion
The U.S. imports of goods in 2021 reached a record-high of $2.8 trillion, driven by increased demand for industrial supplies and materials. This trend has significant implications for the country's economic landscape and highlights the diverse roles played by different states. By understanding the distribution and drivers of these imports, stakeholders can make informed decisions to support economic growth and industrial development.
Watch the Reel
Questions readers ask
Which states were the top importers in the U.S. in 2021?
In 2021, California led the nation in import value, driven by its large consumer market and major ports. Other top importing states included Texas, New York, and Illinois, each with significant industrial and consumer demands. These states are crucial for understanding the overall U.S. import trends and economy.
How did the U.S. trade deficit correlate with import levels in 2021?
The record-high trade deficit in 2021 was directly linked to the surge in imports. With $2.8 trillion in goods imported, the U.S. saw a significant gap between imports and exports, leading to a deficit of over a trillion dollars. This highlights the impact of import levels on the overall trade balance.
What factors contributed to the high import levels in 2021?
Several factors drove the high import levels in 2021, including increased consumer demand, supply chain disruptions, and economic recovery efforts. Additionally, low-interest rates and government stimulus programs encouraged spending, further boosting imports.
Which state had the highest import growth rate in 2021?
While the article does not specify the exact growth rates, states with significant industrial activities, such as California, Texas, and Illinois, likely experienced notable import growth. These states have large economies and major ports, facilitating high import volumes.
How can understanding state-by-state import data benefit businesses?
State-by-state import data helps businesses identify regional demands and supply chain opportunities. By analyzing import trends, businesses can make informed decisions about production, distribution, and market entry strategies. This data is also crucial for optimizing logistics and supply chain management.
What role did California play in the U.S. import landscape in 2021?
California was a pivotal player in the U.S. import landscape in 2021, leading the nation in import value. The state’s large consumer market, extensive infrastructure, and major ports, such as the Port of Los Angeles and Port of Long Beach, facilitated a substantial volume of imports.
Recent articles
Fresh deep dives from the latest Reels we unpacked.




Comments
Be the first to comment.