Household Income Distribution
Household income distribution across the United States is a critical aspect of understanding the nation's economic landscape. By visualizing this distribution, we can gain valuable insights into the economic disparities that exist.
Context / Why this matters
Rising inflation and interest rates, coupled with the potential for a recession, have brought household income disparities into sharp focus. As the economy fluctuates, it's essential to understand how different households are affected. This visualization provides a clear breakdown of how income is distributed among U.S. households, offering a snapshot of the current economic situation.
Income Brackets and Distribution
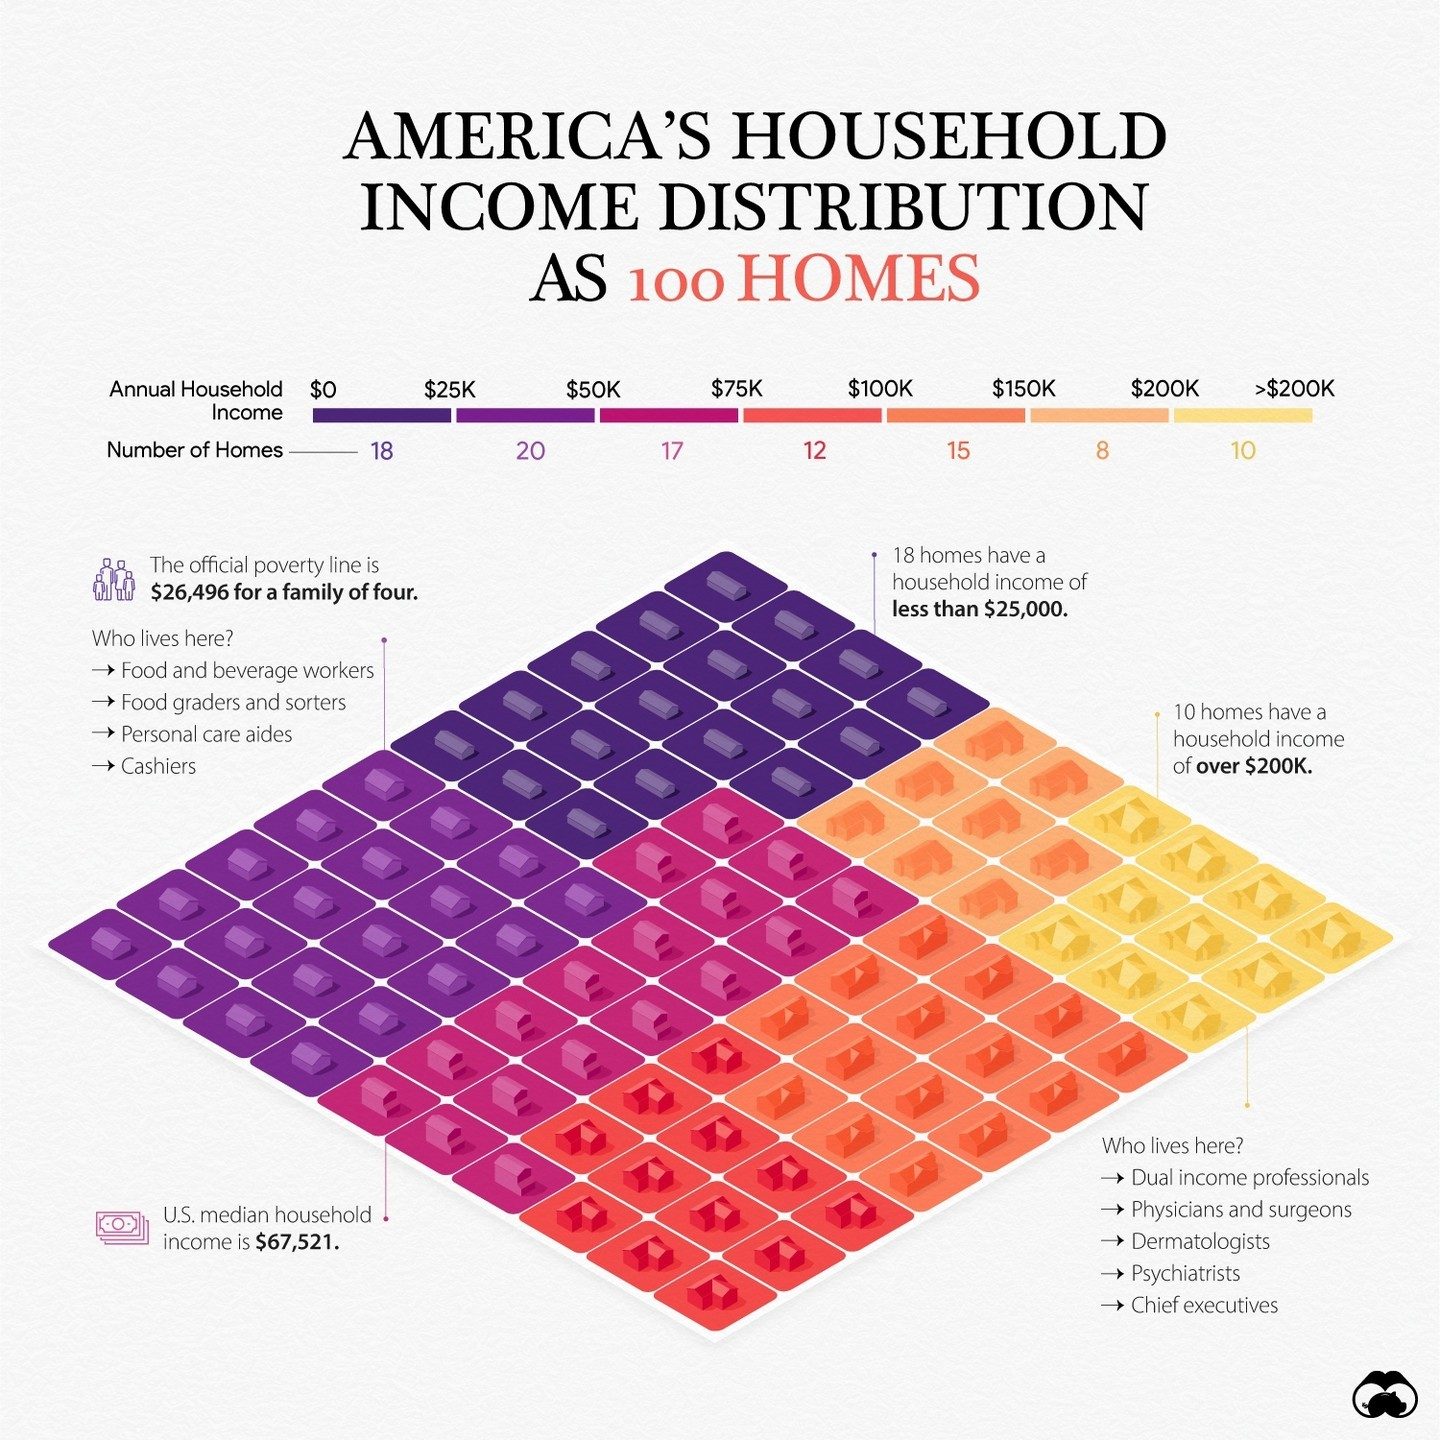
The visualization represents the distribution of household income in America as a neighborhood of 100 homes. Each home is grouped by income brackets, ranging from $0 to over $200,000. This breakdown offers a clear view of the economic diversity within the United States.
Lower Income Brackets
- $0 to $25,000: 18 homes fall into this lowest income bracket. Given the official poverty line for a family of four is $26,496, a significant portion of these households are living below the poverty line, with 18 homes having a household income of less than $25,000. These families face severe financial challenges and may rely on government assistance or support from local communities to meet basic needs.
Middle Income Brackets
- $25,000 to $50,000: 20 homes fall within this range. These households may struggle to meet basic needs but are more likely to have some form of employment. This income level can be challenging, as families may need to prioritize essential expenses and cut back on non-essential spending.
- $50,000 to $75,000: 17 homes fall within this bracket. While still considered middle- to lower-middle-class, these households have a bit more financial flexibility. They may have stable employment and be able to save a small amount each month.
- $75,000 to $100,000: 12 homes fall in this range. These households are likely to have more stable employment, better access to healthcare, and a greater ability to save. They may also have more disposable income for non-essential expenses, like vacations or dining out.
- $100,000 to $150,000: 15 homes fall into this bracket. These households are generally considered upper-middle-class. They may have multiple sources of income, own a home, and have some financial stability, although they may still face financial challenges, especially with rising costs of living and inflation.
Higher Income Brackets
- $150,000 to $200,000: 8 homes fall in this category. These households have a relatively high income, which provides them with greater financial security and the ability to save and invest.
- Over $200,000: 10 homes fall into this bracket. These households have a significant income, which can provide them with substantial financial stability, assets, and access to broader economic opportunities.
Professions and Income Levels
The visualization also highlights specific professions and their associated income levels, providing a clearer picture of the income distribution:
- Lower Income Professions: Food and beverage workers, food graders and sorters, personal care aides, and cashiers are typically associated with lower income brackets. These professions often require less education and training, and as a result, offer lower wages.
- Median Income: The U.S. median household income is $67,521, reflecting the middle point of the income distribution.
- Higher Income Professions: Dual income professionals, dermatologists, psychiatrists, and chief executives are generally associated with higher income brackets. These professions often require extensive education, specialized skills, and experience, which can lead to higher wages and financial stability.
U.S. Median Household Income
The median household income in the U.S. is $67,521. This figure represents the middle point of the income distribution, meaning that half of all households earn less than this amount, and the other half earn more. This median income is a crucial benchmark for understanding the overall economic well-being of households across the country.
Income Inequality and Wealth Disparity
The visualization underscores the significant income inequality and wealth disparity in the U.S. The stark contrast between the lowest and highest income brackets highlights the economic challenges faced by many households and the advantages enjoyed by others. Understanding these disparities is critical for policymakers, economists, and individuals seeking to address economic inequality and promote greater financial stability for all households.
Practical Tips
Understanding household income distribution can inform various aspects of personal and public policy planning. Here are a few practical tips:
For Individuals
- Budgeting: If you find yourself in a lower income bracket, consider creating a detailed budget to manage your finances effectively. This can help you prioritize essential expenses and allocate any surplus to savings or debt repayment.
- Skill Development: Investing in education and skill development can open up opportunities for higher-income professions. Consider taking courses, earning certifications, or pursuing higher education to enhance your earning potential.
- Financial Planning: Regardless of your income bracket, having a financial plan can help you navigate economic challenges. Work with a financial advisor to create a plan tailored to your goals and circumstances.
For Policymakers
- Support Programs: Implementing or enhancing support programs for lower-income households can help address economic disparities. This can include initiatives like affordable housing, access to healthcare, and financial aid for education.
- Economic Opportunities: Policies that promote economic growth and job creation, particularly in lower-income areas, can help reduce income inequality. This can involve incentives for businesses to invest in these areas, as well as infrastructure development.
Important takeaways
Household income distribution in America is a complex issue with far-reaching implications. By visualizing the distribution of income across a neighborhood of 100 homes, we gain valuable insights into the economic disparities that exist. The visualization highlights the significant challenges faced by lower-income households and the advantages enjoyed by higher-income households. Understanding these disparities is crucial for addressing income inequality and promoting greater financial stability for all households.
Conclusion
The distribution of household income in the United States reveals a stark contrast between the highest and lowest income brackets. By visualizing this distribution, we can better understand the economic challenges faced by different households and the systemic issues that contribute to income inequality. This understanding is essential for developing effective policies and strategies to address economic disparities and promote greater financial stability for all households.
Watch the Reel
Questions readers ask
What percentage of American households earn less than $25,000 per year?
According to recent data, a significant portion of American households earn less than $25,000 annually. This group represents a substantial segment of the population, highlighting the economic challenges faced by many individuals and families.
How does the U.S. household income distribution compare to other developed countries?
The U.S. household income distribution shows a wider gap between the rich and the poor compared to many other developed countries. This disparity is often attributed to various factors, including tax policies, access to social services, and job market conditions.
What is the median household income in the United States?
As of recent statistics, the median household income in the U.S. is around $70,000 per year. This figure provides a midpoint where half of the households earn more and half earn less, offering a central measure of the economic landscape.
How many households in the U.S. live below the poverty line?
The number of households living below the poverty line in the U.S. is significant. According to the most recent data, approximately 10.5% of the population, or about 34 million people, live below the official poverty threshold.
What are the key income brackets in the U.S.?
The key income brackets in the U.S. typically range from less than $15,000 to $200,000 and above. These brackets help categorize households based on their annual income, providing a clear picture of the economic stratification within the country.
How does household income distribution impact social services and policies?
Household income distribution plays a crucial role in shaping social services and policies in the U.S. Understanding the distribution helps policymakers allocate resources more effectively, address economic disparities, and implement programs aimed at improving living standards for all households.
What trends are observed in the income distribution in the US over the past decade?
Over the past decade, the income distribution in the U.S. has shown a trend of increasing inequality, with the top earners seeing significant income growth while many lower-income households have struggled to keep pace with rising costs. This trend has been exacerbated by economic fluctuations and policy changes.
Recent articles
Fresh deep dives from the latest Reels we unpacked.




Comments
Be the first to comment.