U.S. Immigration Trends: A Detailed Look from 2001 to 2024
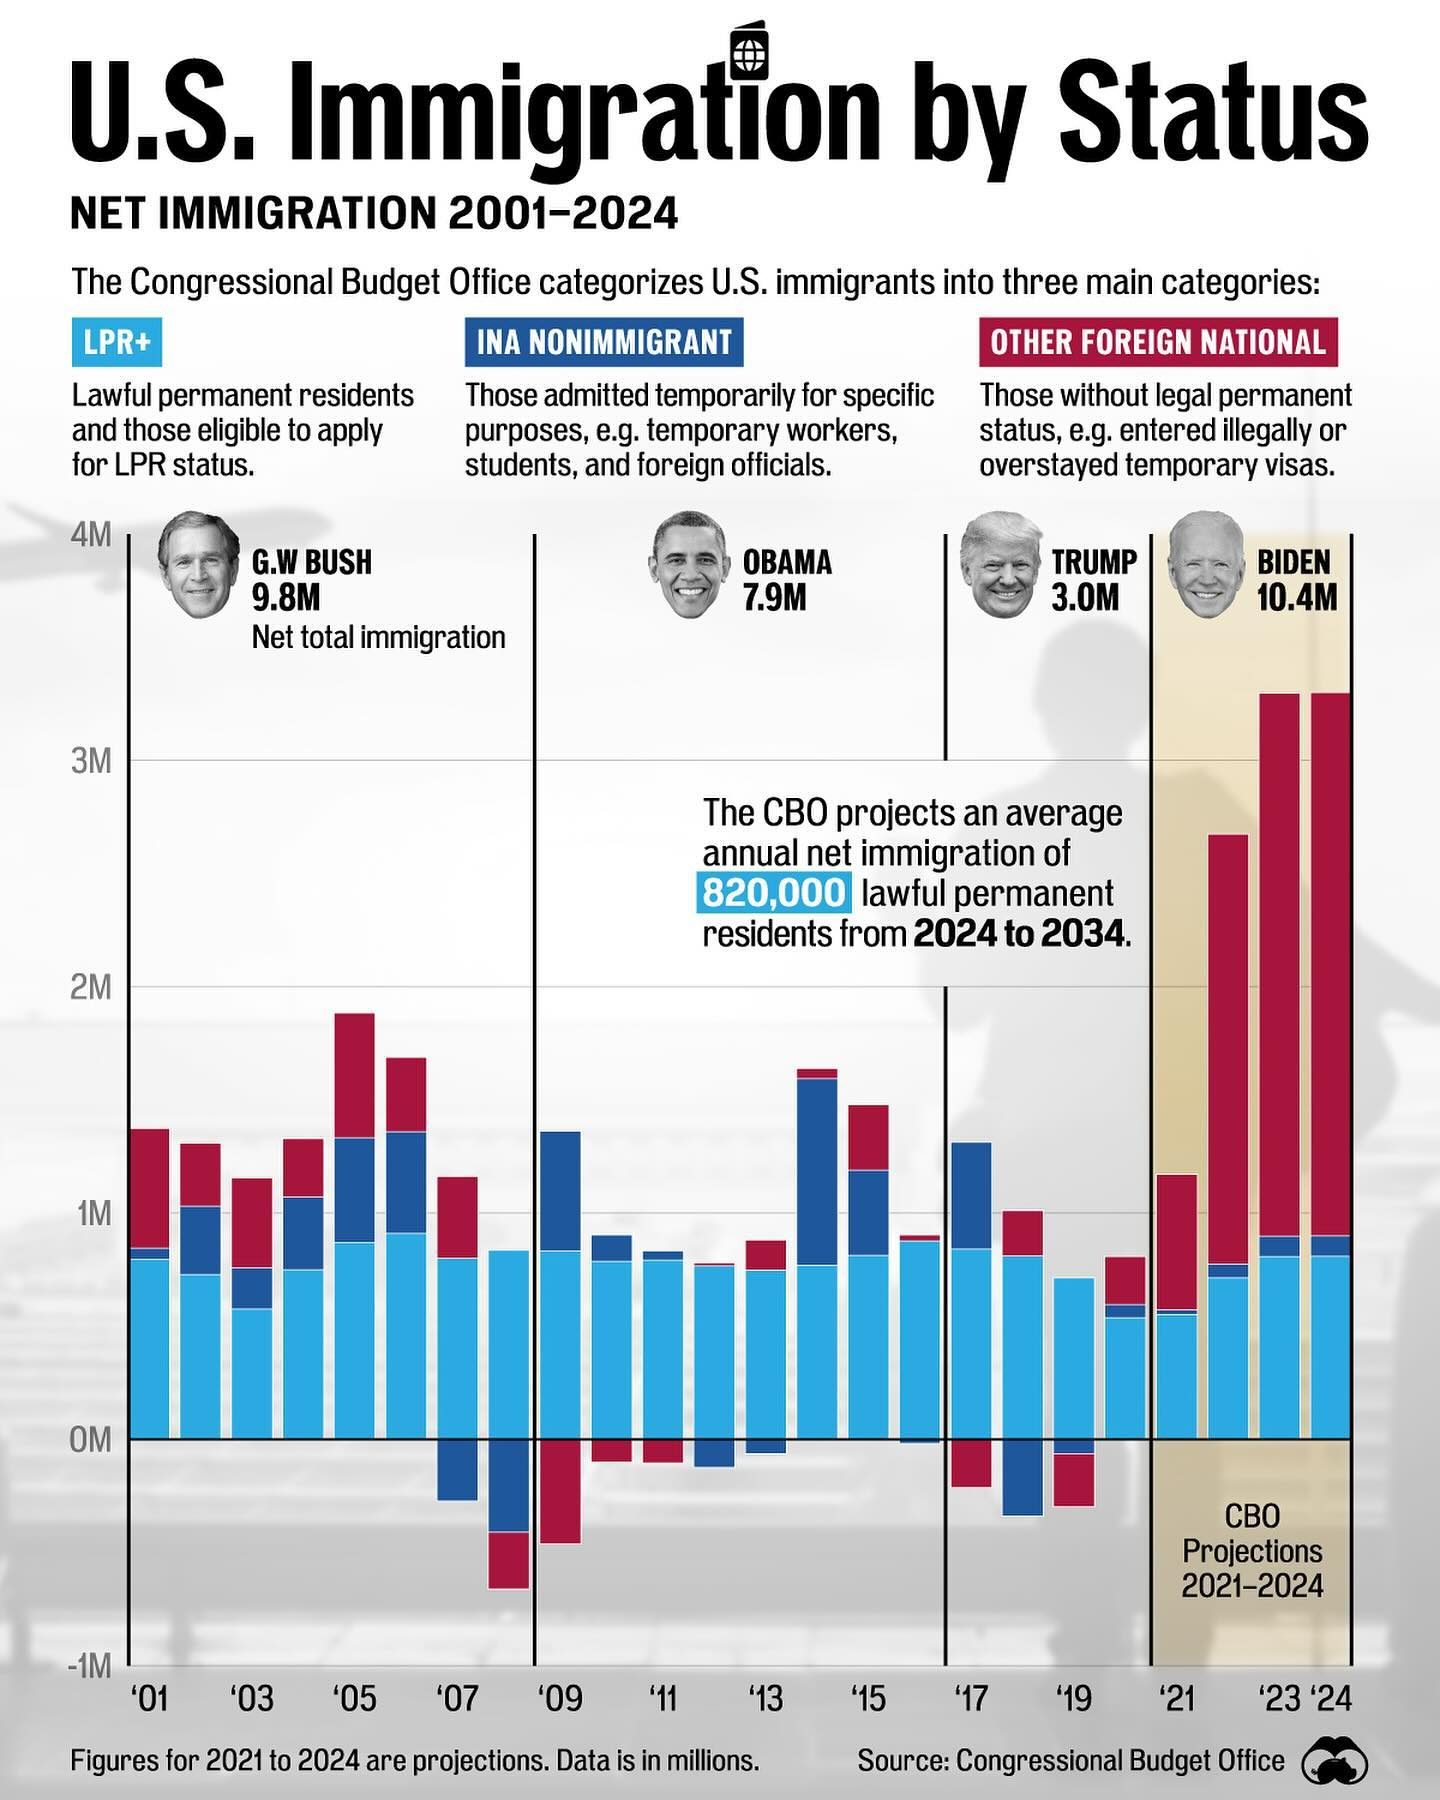
U.S. immigration trends have been significant in the last few decades, with notable changes under different presidential administrations. The data shows a substantial surge in immigration under President Biden, with projections indicating over 10 million additions to the immigrant population between 2021 and 2024. This is a stark contrast to the lowest point during Trump’s presidency, where net immigration totaled just 3 million. The Congressional Budget Office (CBO) breaks down U.S. immigration into three main categories: Lawful Permanent Residents (LPR), Nonimmigrants (INA), and Other Foreign Nationals. Let’s dive into this comprehensive data set, examining the trends and implications for U.S. immigration policy.
Context: Why This Matters
Understanding the trends in U.S. immigration is critical for a variety of reasons. Immigration policies shape the demographic landscape, influence the economy, and have significant social and political implications. Whether it's the influx of skilled workers, the influx of students, or the challenges posed by undocumented immigrants, these trends affect every aspect of American life. By examining the data from 2001 to 2024, we can gain insights into how these policies have evolved and what to expect in the coming years.
Main Discussion
Categories of U.S. Immigrants
The CBO categorizes U.S. immigrants into three primary groups:
- Lawful Permanent Residents (LPR): These are individuals with green cards, allowing them to live and work permanently in the U.S. They also include those eligible to apply for LPR status.
- Nonimmigrants (INA): Temporary residents admitted for specific purposes, such as students, temporary workers, and foreign officials.
- Other Foreign Nationals: Immigrants without legal permanent status, including those who entered illegally or overstayed their temporary visas.
Immigration Trends Under Different Presidencies
G.W. Bush (2001-2008)
During this period, net immigration totaled 820,000. The administration saw a more balanced approach, with policies that focused on both enforcement and pathways to citizenship. Significant increases in immigration occurred, driven by economic opportunities and family reunification programs.
Obama (2009-2016)
Net immigration during the Obama administration reached 7.9 million. Immigration policies were marked by expanded Deferred Action for Childhood Arrivals (DACA) and other executive actions aimed at providing relief to certain immigrant groups. This period also saw the implementation of stricter border controls and deportation policies, leading to a mixed impact on overall immigration numbers.
Trump (2017-2020)
The Trump administration saw the lowest net immigration in recent decades, with only 3.0 million immigrants. The focus was heavily on tougher border controls, stricter immigration policies, and a reduction in the number of refugees and asylum seekers. These policies aimed to limit illegal immigration but also impacted legal immigration pathways, leading to a significant decline in new immigrant entries.
Biden (2021-Present)
Under the current administration, projections indicate a net immigration of 10.4 million individuals between 2021 and 2024. The Biden administration has emphasized a more humane and inclusive approach, reversing many of the restrictive policies from the previous administration. Efforts to modernize the immigration system, provide pathways to citizenship, and address the root causes of migration have contributed to the projected increase.
Future Projections
The CBO projects an average annual net immigration of 220,000 lawful permanent residents from 2024 to 2034. This projection is based on current policies and trends, suggesting a more stable but significant flow of immigrants into the country. These projections will be influenced by future policy changes, economic conditions, and global events.
Key Factors Influencing Immigration
Several factors influence these trends, including economic conditions, geopolitical events, and internal policies:
- Economic Conditions: The U.S. economy remains a significant draw for immigrants seeking better job opportunities and living standards.
- Geopolitical Events: Conflicts and instability in other regions drive migration to the U.S. as a safe haven.
- Policy Changes: The policies implemented by each administration significantly impact the flow of immigrants, whether through stricter controls or more inclusive measures.
Practical Tips
Navigating U.S. immigration can be complex, whether you're an individual seeking opportunities or a policy-maker aiming to understand the landscape. Here are some practical tips:
- Stay Informed: Keep up-to-date with policy changes that could affect your status or plans.
- Seek Professional Help: Consult with immigration lawyers or advisors to navigate the complex legal processes.
- Engage with Community Resources: Utilize community organizations and support networks that offer guidance and assistance.
Important Takeaways
- U.S. immigration has seen significant fluctuations under different administrations, from the balanced approach of G.W. Bush to the restrictive policies of Trump and the inclusive measures under Biden.
- The CBO’s projections indicate a continued but stable flow of immigrants, influenced by economic conditions, geopolitical events, and internal policies.
- Understanding these trends is crucial for shaping future policies and addressing the challenges and opportunities presented by immigration.
Conclusion
The data from 2001 to 2024 provides a comprehensive view of U.S. immigration trends, highlighting the impact of different policies and global events. As we move forward, it’s essential to continue monitoring these trends and adapting policies to address the evolving needs and challenges of immigration. Whether you're an individual seeking opportunities, a policy-maker, or simply interested in the socio-economic landscape, staying informed about these trends is key to navigating the complexities of U.S. immigration.
Watch the Reel
Questions readers ask
What are the main categories of immigrants in the U.S. as defined by the Congressional Budget Office?
The Congressional Budget Office categorizes immigrants into three main groups: Lawful Permanent Residents (LPR), Nonimmigrants (INA), and Other Foreign Nationals. These categories help to understand the different pathways and statuses of immigrants in the U.S.
How does the projected immigration under Biden compare to the numbers during the Trump administration?
Under President Biden, the U.S. is projected to see over 10 million additions to the immigrant population between 2021 and 2024. In contrast, the Trump administration saw a significant decrease, with net immigration totaling just 3 million at its lowest point.
What were some of the key features of Trump's immigration policies?
Trump's immigration policies were marked by stricter enforcement measures, reduced refugee admissions, and changes to visa programs, including temporary restrictions on certain nonimmigrant visas. These policies resulted in a decrease in overall immigration during his tenure.
How have U.S. immigration trends changed over the past two decades?
U.S. immigration trends have fluctuated significantly over the past two decades, with notable surges and declines under different presidential administrations. The data from 2001 to 2024 shows varying patterns, influenced by policy changes and global events.
What data does the article provide on nonimmigrant visas (INA) during the Biden and Trump eras?
The article does not provide specific data on nonimmigrant visas (INA). However, it notes the overall number of immigrants under Biden and Trump, which includes nonimmigrants, lawful permanent residents, and other foreign nationals.
Recent articles
Fresh deep dives from the latest Reels we unpacked.




Comments
Be the first to comment.