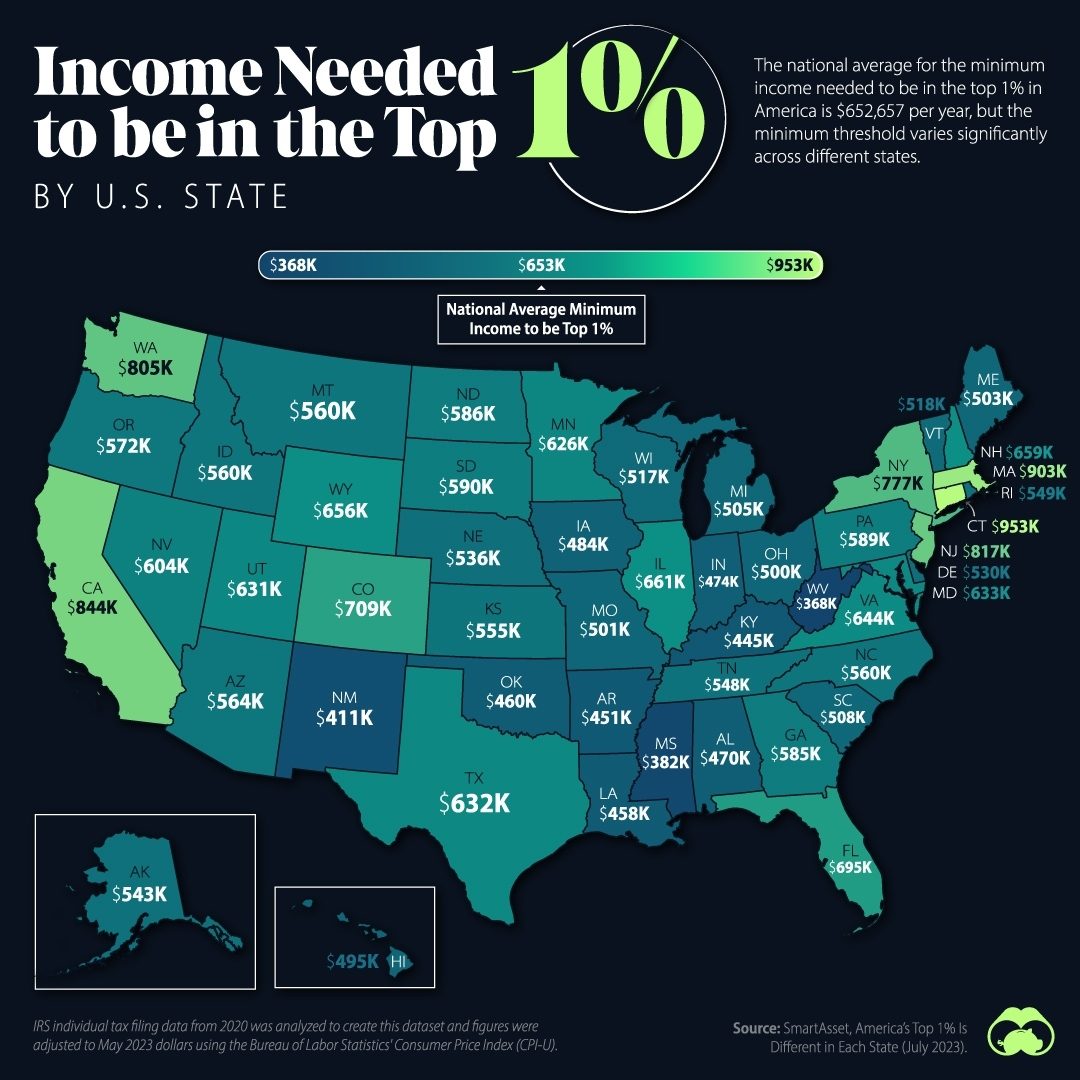
Income Needed for Top 1% in Each U.S. State
The annual income required to be part of the top 1% in America varies significantly from one state to another. The personal finance advisory services company, SmartAsset, has compiled data revealing the annual income thresholds for the top 1% in each state. Understanding these figures can provide valuable context for those interested in the financial landscape across the country.
Context / Why This Matters
The income threshold for the top 1% is a critical benchmark in personal finance and economic analysis. It offers insight into the wealth distribution and the financial status of different regions. This information can be beneficial for individuals aiming to enter the top 1% and for policymakers seeking to understand economic disparities.
Incomes by State
National Average
The national average for the minimum income needed to be in the top 1% in America is $652,657 per year. This figure serves as a baseline, but it's essential to note that the threshold varies significantly by state.
High-Income States
- Washington: To be in the top 1% in Washington, a household needs to earn at least $805,000 annually. This high threshold reflects the state's robust economy and high cost of living, particularly in urban areas like Seattle.
- New York: New York tops the list with an income requirement of $903,000 to make it to the top 1%. The high cost of living in cities like New York City drives up this threshold.
- Rhode Island: Rhode Island requires a minimum annual income of $777,000. This small state has a relatively high cost of living, particularly in the Providence area, which contributes to this high threshold.
- New Jersey: To be in the top 1% in New Jersey, a household needs to earn at least $817,000. This is reflective of the state's high property taxes and cost of living, especially in areas near New York City.
- Virginia: In Virginia, the top 1% earn at least $633,000 annually. This state's threshold is influenced by its proximity to Washington, D.C., and the high salaries in the tech and government sectors.
Mid-Range Incomes
- Oregon: Oregon has a top 1% threshold of $586,000. This is significantly lower than Washington but still reflects the state's relatively high cost of living, particularly in Portland.
- Colorado: To be in the top 1% in Colorado, a household needs to earn at least $600,000. This reflects the state's strong economy and the high cost of living in cities like Denver and Boulder.
Lower-Income States
- North Dakota: North Dakota has a more modest threshold of $503,000 for the top 1%. This lower figure is influenced by the state's lower cost of living and a more diverse economic landscape.
- Maine: In Maine, the top 1% earn at least $518,000. This is one of the lower thresholds, reflecting the state's relatively lower cost of living, particularly in rural areas.
- Florida: Florida has a top 1% threshold of $695,000. This is influenced by the state's high concentration of wealthy retirees and the high cost of living in areas like Miami and Naples.
Factors Affecting Income Thresholds
Several factors contribute to the varying income thresholds for the top 1% across states:
- Cost of Living: Urban areas with high housing and living costs tend to have higher thresholds. For example, New York and California have some of the highest thresholds due to their expensive real estate markets.
- Economic Diversity: States with a more diverse economy, such as North Dakota, may have lower thresholds due to a broader range of income levels.
- Industry Concentration: States with a high concentration of high-paying industries, such as tech in Washington and finance in New York, generally have higher thresholds.
- Population Density: More densely populated states, like New Jersey and Massachusetts, often have higher thresholds due to higher living costs and competition for resources.
- Tax Policies: State tax policies can also influence the income required to be in the top 1%. States with higher tax rates may have lower thresholds because the tax burden reduces the disposable income.
Practical Tips for Aspiring High Earners
If you're aiming to join the top 1% in your state, here are some practical tips to consider:
- Career Choices: Choose a high-paying career path. Fields such as medicine, law, finance, and technology often offer higher salaries.
- Location: Consider where you live. Moving to a state with a lower cost of living can significantly improve your financial position.
- Investment: Smart investing can help grow your wealth. Diversify your investment portfolio to mitigate risks and maximize returns.
- Financial Planning: Work with a financial advisor to develop a strategic plan for savings, investments, and tax planning.
- Networking: Building a strong professional network can open doors to higher-paying opportunities.
Important Takeaways
- Variability by State: The income required to be in the top 1% varies widely by state, reflecting differences in cost of living, industry concentration, and economic diversity.
- National Average: The national average for the minimum income to be in the top 1% is $652,657, but this figure can be significantly higher or lower depending on the state.
- High-Income States: States like New York and Washington have the highest thresholds, often driven by high-cost urban areas and concentrations of high-paying industries.
- Lower-Income States: States like North Dakota and Maine have lower thresholds, reflecting lower living costs and a more diverse economic landscape.
- Economic Factors: Understanding the economic landscape and cost of living in a state can provide valuable insights into why certain thresholds exist.
Conclusion
Understanding the income needed to be in the top 1% in each U.S. state offers a nuanced view of the financial landscape across the country. From high-income states like New York and Washington to lower-income states like North Dakota and Maine, the thresholds reflect a complex interplay of economic factors, cost of living, and industry concentration. For those aiming to join this elite group, strategic career choices, smart financial planning, and a keen understanding of economic trends can pave the way to success.
Watch the Reel
Questions readers ask
What is the highest top 1% income threshold among all U.S. states?
The highest top 1% income threshold is in Connecticut, with an annual income requirement of 903,000 USD. This reflects the state's high cost of living and substantial wealth concentration.
How does the top 1% income threshold in New York compare to other states?
New York has one of the highest top 1% income thresholds, requiring an annual income of 854,000 USD. This places it among the states with the most affluent earners and high cost of living.
Which state has the lowest top 1% income threshold?
The lowest top 1% income threshold is in Mississippi, where an annual income of 633,000 USD is required. This is significantly lower than other states, indicating a lower cost of living and different wealth distribution.
Why do top 1% income thresholds vary so much by state?
Top 1% income thresholds vary by state due to differences in cost of living, local economies, and wealth distribution. States with higher costs of living and concentrated wealth typically have higher thresholds.
How can knowing the top 1% income threshold for a state be useful?
Knowing the top 1% income threshold for a state can provide insights into local economic conditions, help individuals set financial goals, and inform policymakers about economic disparities within the state.
What does the top 1% income threshold tell us about a state's economy?
The top 1% income threshold can indicate the level of wealth concentration and economic disparities within a state. A high threshold may suggest a significant wealth gap, while a lower threshold could indicate more evenly distributed income.
Are the top 1% income thresholds updated annually?
Yes, the top 1% income thresholds can change annually based on economic conditions, inflation, and shifts in local economies. The most recent data for 2023 provides a snapshot of current economic dynamics across the U.S. states.
Related deep dives
Similar reads based on topic and creator.


Recent articles
Fresh deep dives from the latest Reels we unpacked.




Comments
Be the first to comment.