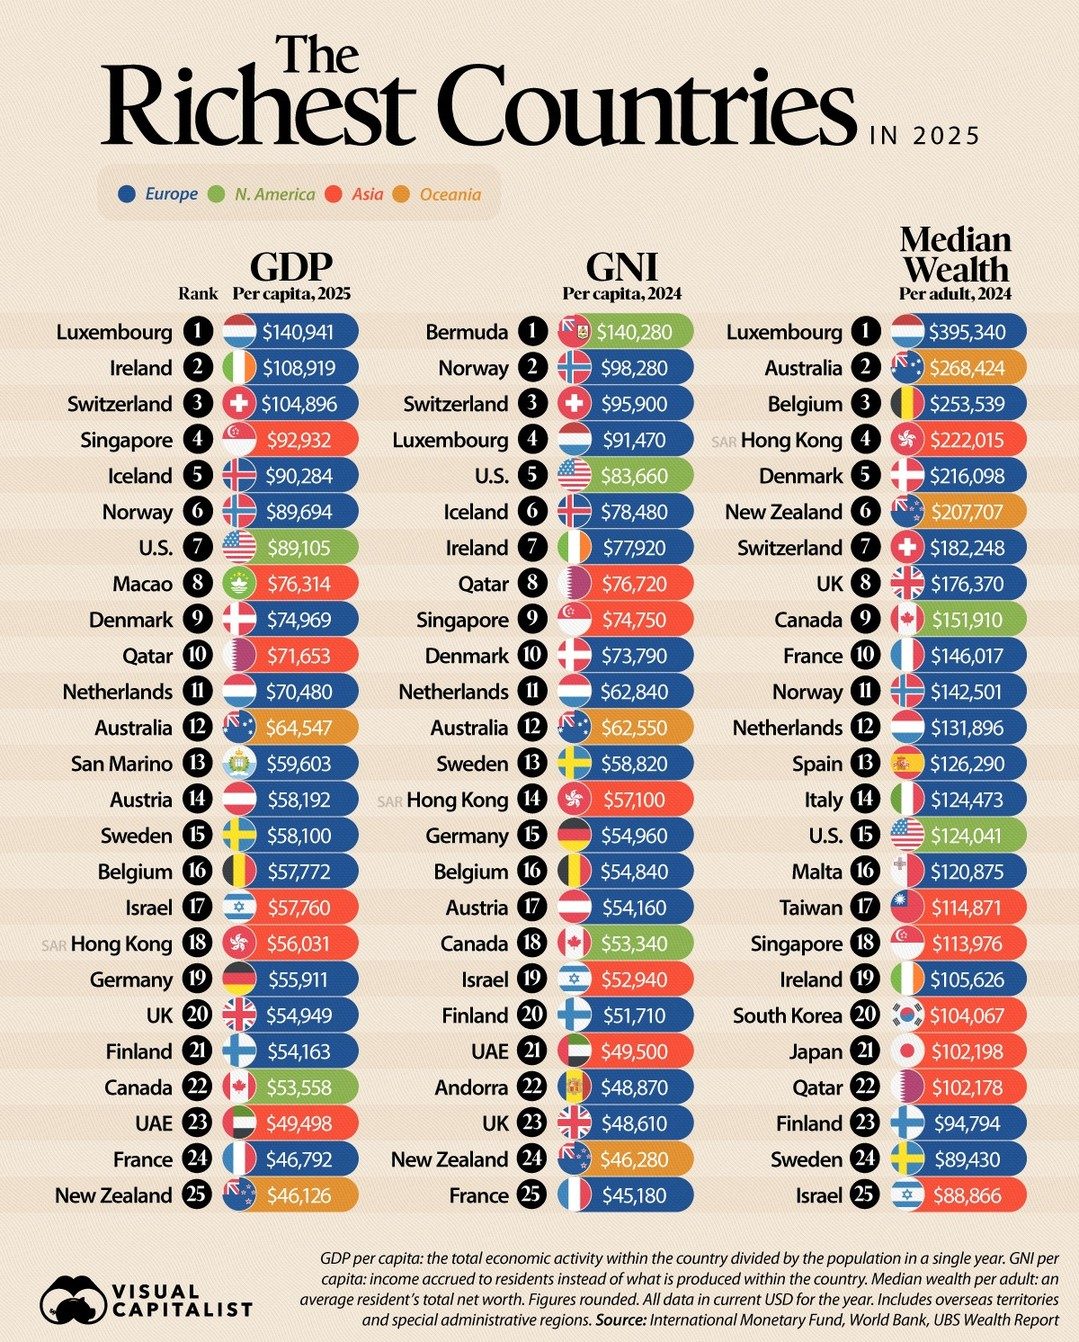
The Richest Countries in 2025
If you're curious about the economic landscape of the world in 2025, you're in the right place. This article dives into the data that reveal the richest countries based on GDP per capita, Gross National Income (GNI) per adult, and median wealth per adult.
Why This Matters
Global economic rankings are more than just numbers; they reflect the economic health and prosperity of nations. Understanding which countries are at the top can provide insights into effective economic policies, living standards, and overall wealth distribution. It's also important to consider the context behind these numbers, as they don't always tell the full story of a nation's wealth and well-being.
Analysis of the Richest Countries
GDP Per Capita
One of the primary metrics for determining a country's wealth is its GDP per capita, which measures the total economic output of a country divided by its population. This figure provides a snapshot of the average economic output per person. It's crucial to note that GDP per capita does not always reflect the standard of living for the average resident, as many countries rely on non-resident income.
Luxembourg
Luxembourg tops the list with a staggering GDP per capita of $140,941. This high figure can be attributed to its status as a significant financial center and a hub for international corporations. However, a significant portion of this income is generated by non-resident workers who commute into the country for work, which skews the actual wealth distribution among residents. This means that while Luxembourg leads in GDP per capita, the wealth may not be evenly distributed among its population.
GNI Per Adult
Gross National Income (GNI) per adult is another crucial metric, as it measures the total income received by residents from all sources, including foreign investments. This measure can provide a more accurate picture of the wealth available to the average resident.
Switzerland and San Marino
Switzerland and San Marino stand out in this category. Switzerland has a GNI per adult of $95,900, reflecting its strong economy and high standard of living. San Marino, a small microstate surrounded by Italy, has a GNI per adult of $146,017, making it one of the wealthiest countries globally. This high figure is likely due to its favorable tax policies, which attract international financial services and investments.
Median Wealth Per Adult
Median wealth per adult is perhaps the most direct indicator of a country's overall prosperity. It measures the wealth of the average individual, providing a clear picture of how wealth is distributed among the population. This metric can help reveal which countries have the most equitable distribution of wealth.
Luxembourg and San Marino
Luxembourg and San Marino again top the list in median wealth per adult. San Marino has a median wealth per adult of $395,539, reflecting its status as a wealthy microstate with a high concentration of wealth among its residents. Luxembourg follows closely with a median wealth per adult of $268,424. This figure is significantly higher than the economic output per capita, indicating that Luxembourg's wealth is more evenly distributed, especially when compared to countries like Qatar.
Qatar
Qatar’s high GDP per capita of $72,000 is primarily driven by its substantial oil reserves. However, this wealth has not translated into broader prosperity for the average resident. Qatar's median wealth per adult is significantly lower, indicating that the country's wealth is highly concentrated among a small elite. This disparity highlights the importance of considering multiple metrics when evaluating a country's economic health.
Comparing Regions
Europe
Europe is home to some of the wealthiest countries in the world. Luxembourg, Switzerland, and San Marino lead the rankings, reflecting their strong economies, favorable tax policies, and high standards of living. Other European countries, such as Ireland, Denmark, and Norway, also rank high, indicating a region of economic prosperity.
North America
The United States ranks 7th in GDP per capita with $89,105, reflecting its status as a global economic powerhouse. However, its ranking in GNI per adult and median wealth per adult indicates a significant wealth disparity within the country. Canada, another North American country, ranks 12th in GDP per capita, showing a more balanced economy with a higher median wealth per adult.
Asia
Asia is a diverse region with a range of economic conditions. Singapore, Macao, and Hong Kong top the GDP per capita rankings in Asia, reflecting their status as financial hubs. However, countries like China and India have much lower rankings, indicating significant economic disparities within the region. These variations highlight the importance of considering multiple metrics when evaluating a country's economic health.
Oceania
Oceania is home to several wealthy countries, with Australia and New Zealand ranking high in GDP per capita. Australia, in particular, has a strong economy with a high median wealth per adult, reflecting its prosperity. New Zealand, while lower in GDP per capita, has a higher median wealth per adult, indicating a more equitable distribution of wealth.
Practical Tips for Evaluating Economic Data
When evaluating economic data, it's important to consider multiple metrics to gain a comprehensive understanding of a country's economic health. Here are some practical tips for interpreting economic data:
- Look at multiple metrics: GDP per capita, GNI per adult, and median wealth per adult all provide different insights into a country's economic health. By considering multiple metrics, you can gain a more comprehensive understanding of a country's wealth and prosperity.
- Consider the context: Economic data can be influenced by a variety of factors, including tax policies, trade agreements, and international investments. When evaluating economic data, it's important to consider the context behind the numbers.
- Compare with other countries: Comparing economic data across countries can provide valuable insights into a nation's economic performance. By looking at how a country ranks compared to others, you can gain a better understanding of its economic strengths and weaknesses.
- Consider wealth distribution: Median wealth per adult is a crucial metric for understanding a country's wealth distribution. By considering this metric, you can gain a better understanding of how wealth is distributed among a country's population.
Important Takeaways
Understanding the economic landscape of the world in 2025 requires a nuanced approach that considers multiple metrics and the context behind the numbers. Here are the key takeaways:
- Luxembourg and San Marino are the wealthiest countries in 2025, but their economic prosperity is not evenly distributed.
- Qatar's high GDP per capita is driven by oil, but this wealth has not translated into broader prosperity for the average resident.
- Europe and North America are home to some of the wealthiest countries in the world, reflecting their strong economies and high standards of living.
- Asia is a diverse region with a range of economic conditions, reflecting significant disparities in wealth distribution.
- Oceania is home to several wealthy countries, with Australia and New Zealand ranking high in GDP per capita and median wealth per adult.
- When evaluating economic data, it's important to consider multiple metrics and the context behind the numbers.
Conclusion
The global economic landscape in 2025 is complex and multifaceted, with different countries leading in various metrics. By considering GDP per capita, GNI per adult, and median wealth per adult, you can gain a comprehensive understanding of a country's economic health and prosperity. This nuanced approach reveals that the richest countries in the world are not always the most prosperous, highlighting the importance of considering multiple metrics and the context behind the numbers.
Watch the Reel
Questions readers ask
What is GDP per capita and why is it important in determining the richest countries in 2025?
GDP per capita is a measure of the total economic output of a country divided by its population. It provides a snapshot of the economic performance, standard of living, and wealth distribution of a country. In 2025, it will be a key indicator of which countries have the highest individual economic productivity and living standards.
Which country is expected to rank at the top in terms of GNI per adult in 2025?
The country with the highest GNI per adult in 2025 is projected to be Luxembourg. This ranking reflects the country's strong economic performance, high productivity, and robust financial sectors.
What does median wealth per adult signify about a country's economic health?
Median wealth per adult gives a clearer picture of wealth distribution by showing the middle point of wealth among adults, unlike GNI per adult or GDP per capita which are averages. A higher median wealth per adult indicates a more equitable distribution of wealth, suggesting broader prosperity among a country's population in 2025.
How does Qatar's economy fare in the 2025 global prosperity rankings?
Qatar is projected to maintain its position as one of the wealthiest nations in 2025, with high rankings in GDP per capita and GNI per adult. This is due to its significant natural gas and oil reserves, which drive its economic growth and contribute to the high living standards of its citizens.
How can understanding these rankings help in comparing the economic policies of different nations?
By examining the rankings of the richest countries in 2025, policymakers and analysts can identify successful economic strategies and policies. Countries that perform well in GDP per capita, GNI per adult, and median wealth per adult may offer insights into effective fiscal, monetary, and social policies, which can inform global economic discussion and policy development.
Recent articles
Fresh deep dives from the latest Reels we unpacked.




Comments
Be the first to comment.