Poverty Rates by State
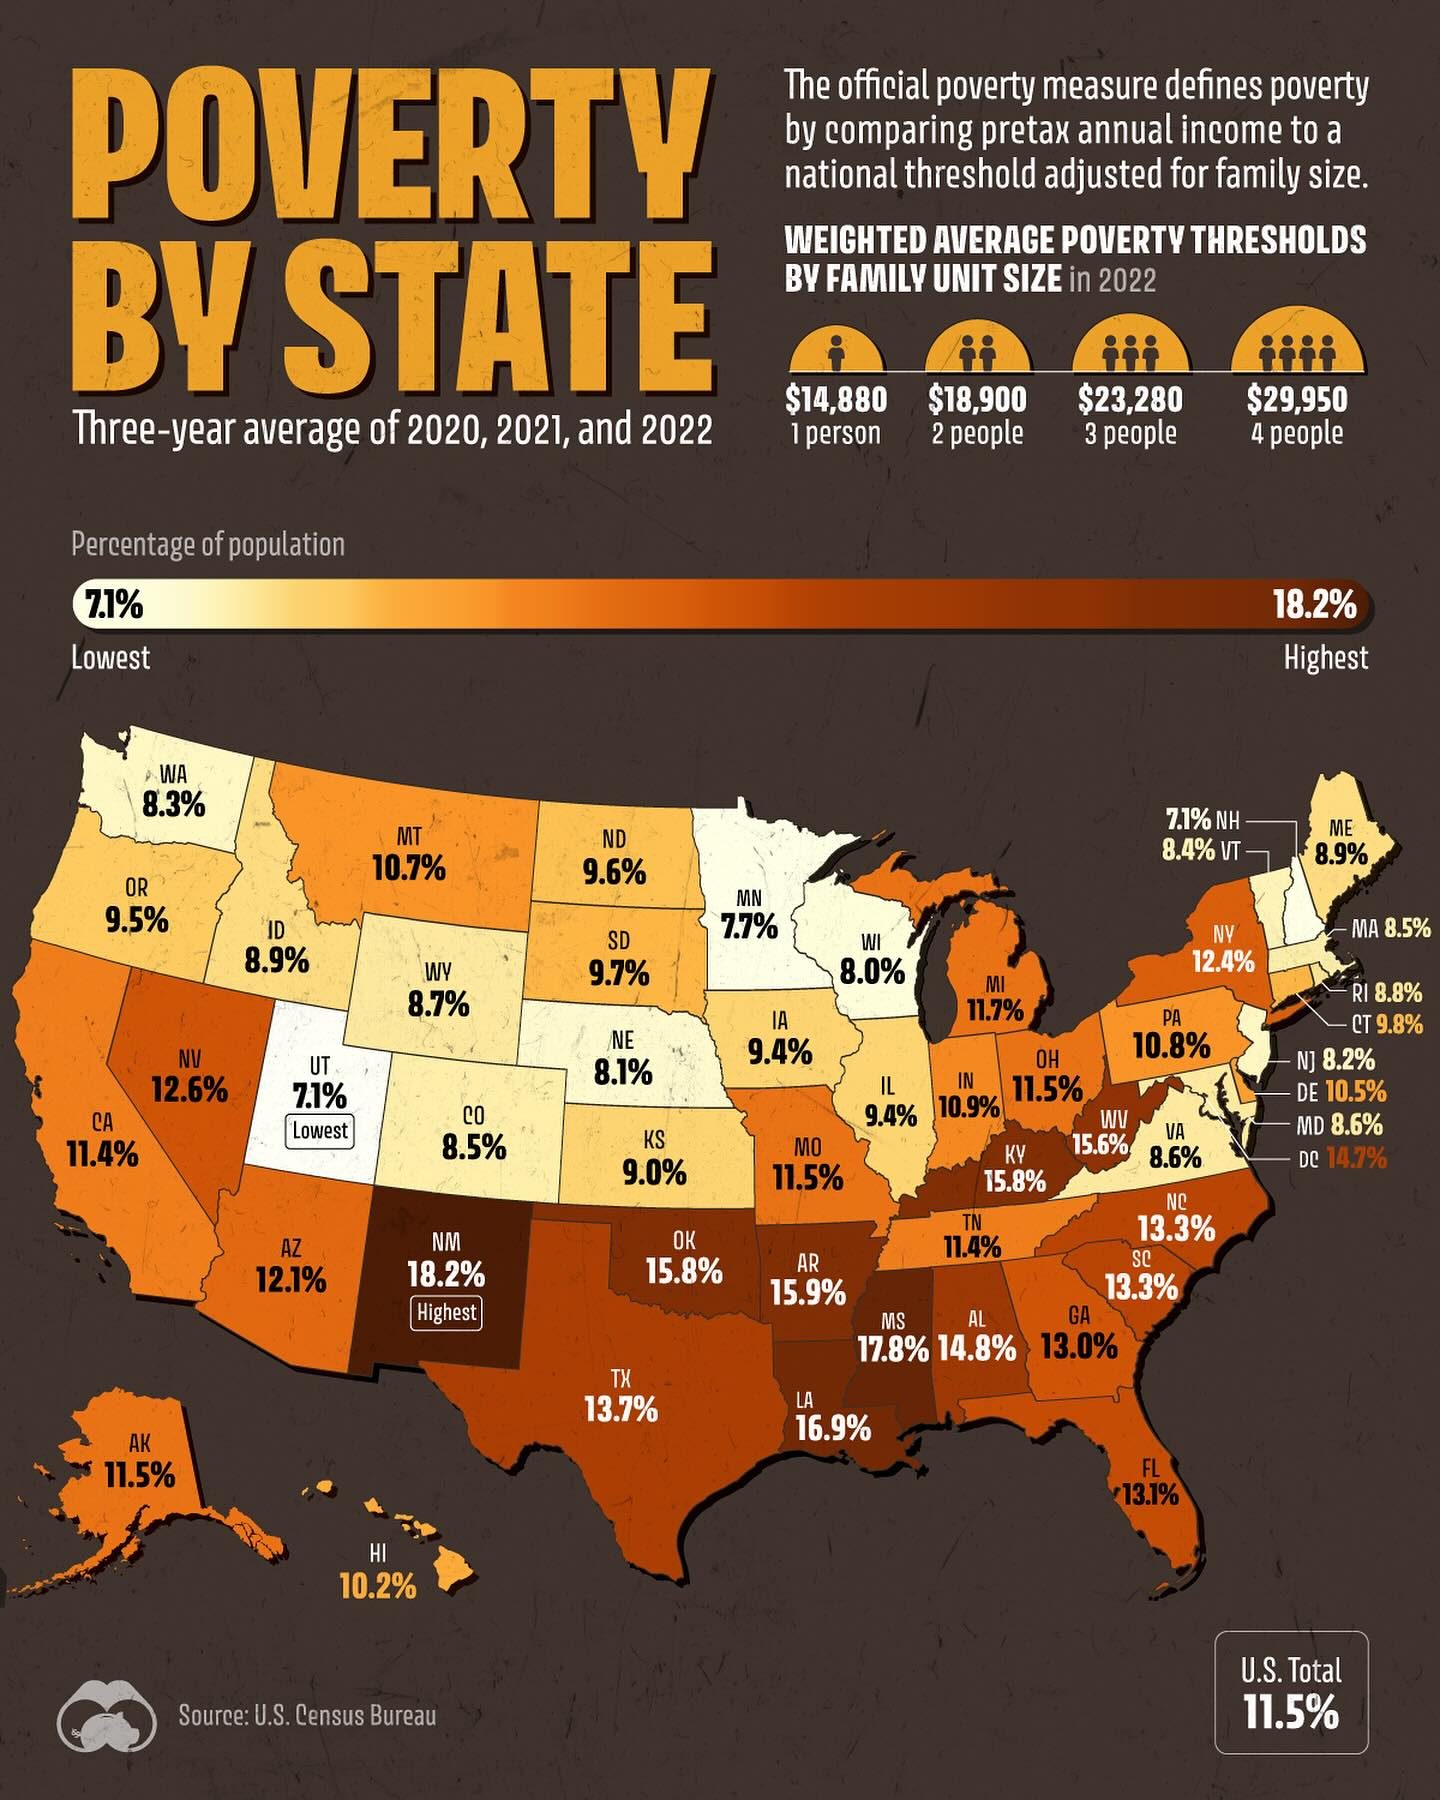
Poverty rates vary significantly across the United States, with Southern states often bearing the brunt of higher percentages of people living in poverty. This disparity is particularly pronounced in states with large rural populations, such as New Mexico, Mississippi, and Louisiana. These states consistently rank highest in poverty rates compared to more urban areas. Understanding these trends is crucial for addressing economic inequality and implementing targeted policies.
Context: Why This Matters
Poverty is a multifaceted issue that affects every aspect of a community, from healthcare access to educational opportunities and overall quality of life. By examining the average poverty rates from 2020 to 2022, as visualized using data from the U.S. Census Bureau, we gain insights into the regions most affected by economic hardship. This data is essential for policymakers, non-profits, and community leaders aiming to allocate resources effectively and develop programs to support those in need.
The data highlights a stark contrast between rural and urban areas. Rural communities often face unique challenges, including limited job opportunities, lower wages, and less access to essential services. These factors contribute to higher poverty rates and underscore the need for tailored solutions that address the specific needs of rural populations.
Main Discussion
Visualizing Poverty Rates
The infographic illustrates the average poverty rates by state over a three-year period, from 2020 to 2022. Each state is color-coded according to its poverty rate, providing a clear visual representation of where the highest concentrations of poverty exist. This map is supported by numerical poverty thresholds based on family size, offering a comprehensive view of economic distress across the nation.
Key States with High Poverty Rates
States like Mississippi and Louisiana stand out as having the highest poverty rates. These states have long struggled with economic challenges, including a lack of diversified industries and limited economic opportunities. Mississippi, in particular, has consistently ranked among the highest in poverty rates, with significant portions of its population living below the poverty line. Louisiana follows closely, with both states facing persistent economic struggles.
Lower Poverty Rates in the North
On the other end of the spectrum, states like Washington have the lowest poverty rates. This can be attributed to factors such as a robust tech industry, higher minimum wages, and more accessible healthcare. These states often have more diverse economies, better job opportunities, and stronger social safety nets, which help to mitigate the impact of poverty.
Economic Inequality and Rural America
The data underscores the deep-seated economic inequality in the United States, particularly between rural and urban areas. Rural communities often lack the infrastructure and job opportunities that urban centers provide, leading to higher poverty rates. Addressing this disparity requires a multi-faceted approach, including investment in rural development, job creation, and access to education and healthcare.
Poverty Thresholds by Family Size
The infographic also includes poverty thresholds based on family size. For a single person, the threshold is $14,880, while for a family of two, it is $18,900. The thresholds increase to $23,280 for three people and $29,950 for a family of four. These thresholds provide a clearer picture of the economic challenges faced by different family sizes, helping policymakers and organizations tailor their support to specific needs.
Practical Tips
For Individuals
Understanding poverty thresholds and local resources can be crucial for individuals and families navigating economic hardship. Here are a few practical tips:
- Know Your Resources: Familiarize yourself with local assistance programs, including food banks, housing assistance, and financial aid.
- Seek Support: Don't hesitate to reach out to community organizations and non-profits for support. Many offer programs specifically designed to help individuals and families in need.
- Educate Yourself: Taking advantage of free educational resources, such as online courses or community workshops, can enhance your skills and open up new job opportunities.
For Communities
Community leaders and organizations play a vital role in addressing poverty. Here are some strategic steps:
- Develop Tailored Programs: Create initiatives that address the specific needs of your community, whether it's job training, healthcare access, or housing support.
- Collaborate with Others: Partner with local businesses, non-profits, and government agencies to maximize resources and impact.
- Advocate for Policy Changes: Work with policymakers to advocate for policies that support economic development, job creation, and social services in your community.
Important Takeaways
- Poverty Rates Vary: The data shows significant variation in poverty rates across different states, with Southern states generally having higher rates.
- Rural vs. Urban Disparities: Rural areas often face higher poverty rates due to limited job opportunities and access to essential services.
- Policy and Resource Allocation: Understanding these trends can help in allocating resources and developing policies to address economic inequality.
Conclusion
The data on poverty rates by state highlights important trends and disparities that need to be addressed. By visualizing this data, we gain a clearer understanding of where the highest concentrations of poverty exist and how economic inequality affects different regions. This knowledge is essential for developing targeted policies and programs that can support communities in need and work towards a more equitable future.
Watch the Reel
Questions readers ask
Which states typically have the highest poverty rates in the U.S.?
Southern states, particularly those with large rural populations, tend to have the highest poverty rates. States like New Mexico, Mississippi, and Louisiana frequently top the lists with significant percentages of their populations living in poverty.
How do rural areas in the South compare to urban areas in terms of poverty rates?
Rural areas in the Southern U.S. often face more pronounced economic challenges and higher poverty rates compared to urban areas. This disparity is a key factor in the overall poverty trends observed in the region.
What are the key factors contributing to higher poverty rates in Southern states?
A variety of factors contribute to higher poverty rates in Southern states, including limited job opportunities, lower wages, and less access to essential services like healthcare and quality housing, particularly in rural areas.
How can understanding poverty rates by state help in addressing economic inequality?
By examining poverty rates by state, policymakers can gain insights into which regions need the most support. This information is crucial for developing targeted policies and allocating resources effectively to address economic inequality.
What data sources are used to track poverty rates in the U.S.?
The U.S. Census Bureau is a primary source for tracking poverty rates in the U.S. The data is collected and analyzed to provide a comprehensive view of poverty trends across different states and regions from 2020 to 2022.
What are the implications of high poverty rates in rural Southern areas?
High poverty rates in rural Southern areas can lead to a range of issues, including limited access to healthcare, reduced quality of life, and fewer opportunities for economic mobility. Addressing these challenges requires a multifaceted approach that includes economic development and community support.
Why is it important to compare average poverty rates by region?
Comparing average poverty rates by region helps identify trends and disparities, informing effective policy interventions. By understanding regional differences, stakeholders can develop more tailored solutions to alleviate poverty and improve overall economic health in the most affected areas.
Recent articles
Fresh deep dives from the latest Reels we unpacked.




Comments
Be the first to comment.