Police Violence in the U.S. — By the Numbers
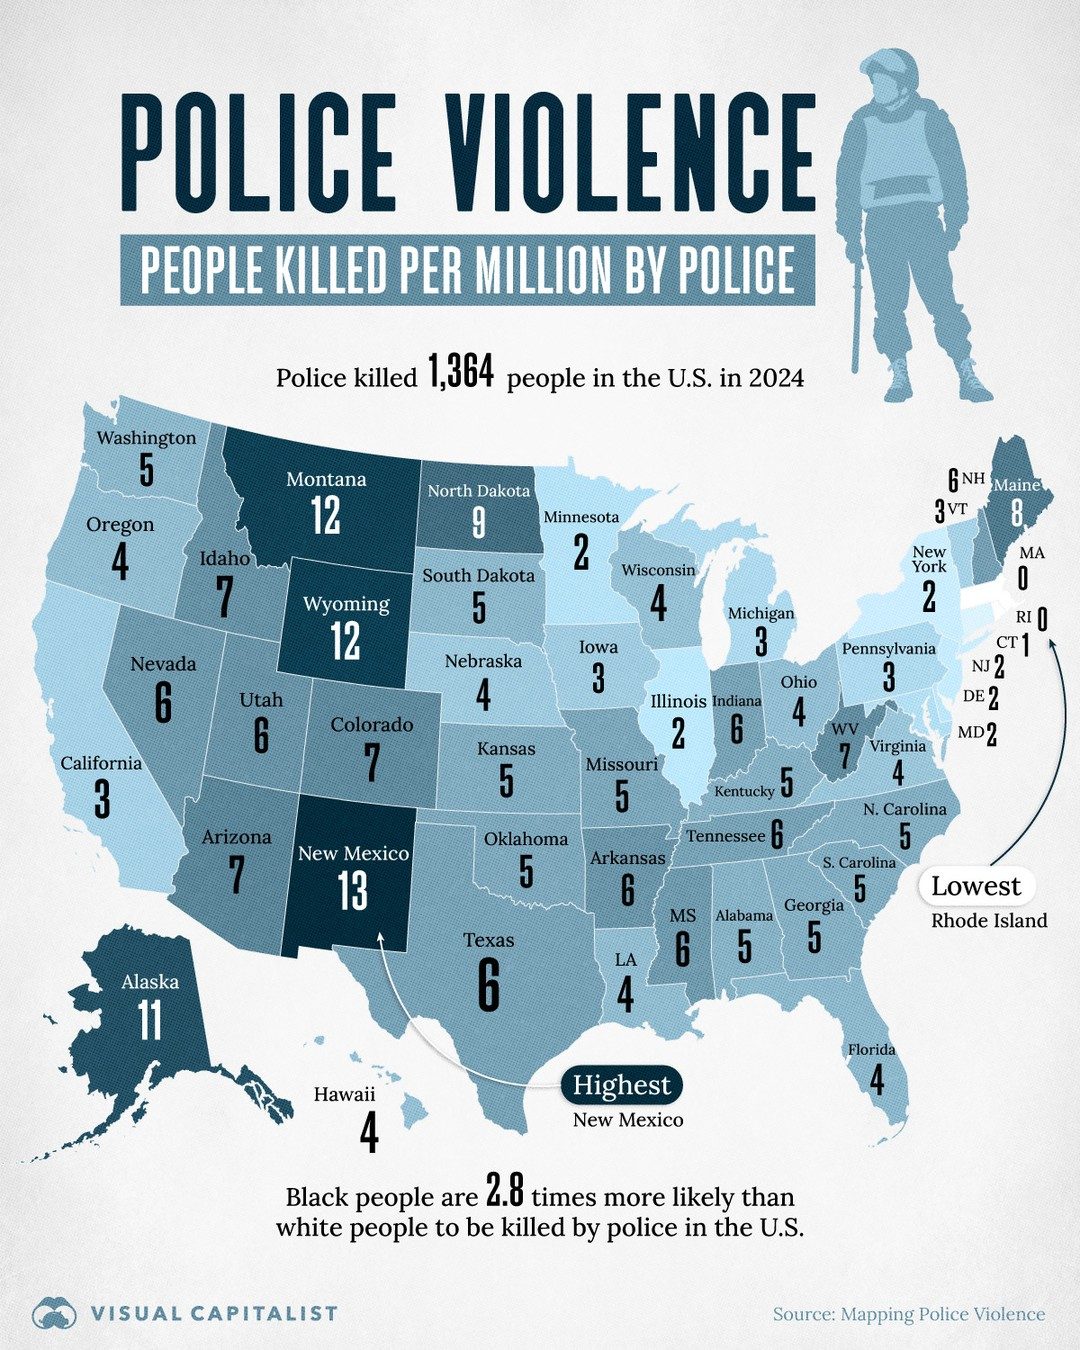
In 2024, American police killed 1,364 people nationwide. Texas reported the highest number of deaths at 165, while New Mexico saw the highest rate of 13.22 people killed per million by police. These numbers, sourced from Mapping Police Violence, highlight the geographic and racial disparities in police-related deaths across the United States.
Why This Matters
Understanding the patterns and disparities in police violence is crucial for fostering informed discussions about public safety, policing strategies, and the urgent need for reforms. By examining the data, we can better comprehend the extent of the issue and identify areas where targeted interventions may be most effective.
Geographic Disparities in Police-Related Deaths
Highest and Lowest Rates of Police Violence
The infographic from Visual Capitalist provides a stark visual representation of the varying rates of police violence across different states. New Mexico's high rate of 13.22 people killed per million stands out, indicating a significant issue that warrants immediate attention. On the other end of the spectrum, Rhode Island reported the lowest rate, suggesting that certain policies or circumstances in the state may be contributing to fewer police-related deaths.
Regional Trends
Examining the data regionally reveals several trends. For instance, Western states like Montana, Idaho, and Wyoming show higher rates of police violence compared to their Eastern counterparts. This regional variance could be influenced by factors such as population density, policing strategies, and socio-economic conditions.
Racial Disparities in Police Violence
One of the most alarming findings is the stark racial disparity in police violence. Black people are 2.8 times more likely than white people to be killed by police in the U.S. This statistic underscores the systemic issues that contribute to the disproportionate use of lethal force against Black individuals. Addressing this disparity requires a multifaceted approach that includes policy reforms, community engagement, and comprehensive training for law enforcement personnel.
Key States and Their Rates of Police Violence
Western States
- Montana: 12 people killed per million.
- Idaho: 7 people killed per million.
- Wyoming: 5 people killed per million.
Southern States
- Texas: 6 people killed per million.
- Oklahoma: 5 people killed per million.
- Arkansas: 6 people killed per million.
Northeastern States
- Maine: No specific rate mentioned, but generally low.
- Rhode Island: Lowest rate, though exact figures are not provided.
Midwestern States
- Minnesota: 3 people killed per million.
- Iowa: 2 people killed per million.
Practical Tips for Understanding and Addressing Police Violence
Stay Informed
Engage with reliable sources of information, such as Mapping Police Violence, to stay updated on the latest statistics and trends. Understanding the current landscape is the first step toward meaningful change.
Advocate for Policy Reforms
Support initiatives aimed at reforming policing strategies and policies. This includes advocating for increased accountability, better training, and the implementation of de-escalation techniques.
Community Engagement
Encourage open dialogue between law enforcement agencies and community members. Building trust and fostering mutual respect can significantly reduce the likelihood of violent encounters.
Data-Driven Solutions
Use data to inform policy decisions and interventions. By identifying areas with high rates of police violence, resources can be directed more effectively to address the root causes.
Important Takeaways
Geographic Variance
The rate of police violence varies significantly across different states, with Western and Southern states generally reporting higher rates compared to Northeastern and Midwestern states.
Racial Disparities
Black individuals are disproportionately affected by police violence, highlighting the need for targeted interventions to address systemic issues.
Data as a Tool
Use of data from sources like Mapping Police Violence is essential for understanding the scope and nature of police violence, enabling informed policy decisions.
Conclusion
The data on police violence in the U.S. paints a clear picture of geographic and racial disparities that demand attention. By staying informed, advocating for policy reforms, engaging communities, and leveraging data-driven solutions, we can work towards reducing police violence and creating a safer society for all.
Watch the Reel
Questions readers ask
Which state had the highest number of police-related deaths in 2024?
Texas reported the highest number of police-related deaths in 2024, with 165 individuals killed by police. This figure underscores the significance of examining the role of policing in public safety within the state.
What is the highest police violence rate per million people in 2024?
New Mexico had the highest rate of 13.22 people killed per million by police in 2024. This rate highlights the need for a closer examination of public safety strategies and police reforms in the state.
How many people were killed by police in the U.S. in 2024?
In 2024, police in the U.S. killed 1,364 people. This figure is crucial for understanding the broader context of police violence across the country and for identifying areas where intervention is most needed.
What are the racial disparities in police-related deaths?
Racial disparities in police-related deaths are a significant concern, with Black people disproportionately affected. Analyzing these disparities can help inform targeted efforts to improve policing and public safety for all communities.
What is the source of the data on police violence in 2024?
The data on police violence in 2024 is sourced from Mapping Police Violence, an organization that tracks and maps police killings nationwide. This data is essential for providing a clear picture of police violence trends and patterns.
Why is it important to examine geographic disparities in police violence?
Examining geographic disparities in police violence helps identify specific regions where public safety and policing strategies may need to be re-evaluated. This information can guide targeted reforms and interventions aimed at reducing police-related deaths.
How can understanding police violence statistics help with reform efforts?
By understanding police violence statistics, policymakers and community leaders can identify key areas for reform and make informed decisions to improve public safety. This knowledge is crucial for fostering discussions and implementing changes that address the urgent need for better policing strategies.
Recent articles
Fresh deep dives from the latest Reels we unpacked.




Comments
Be the first to comment.