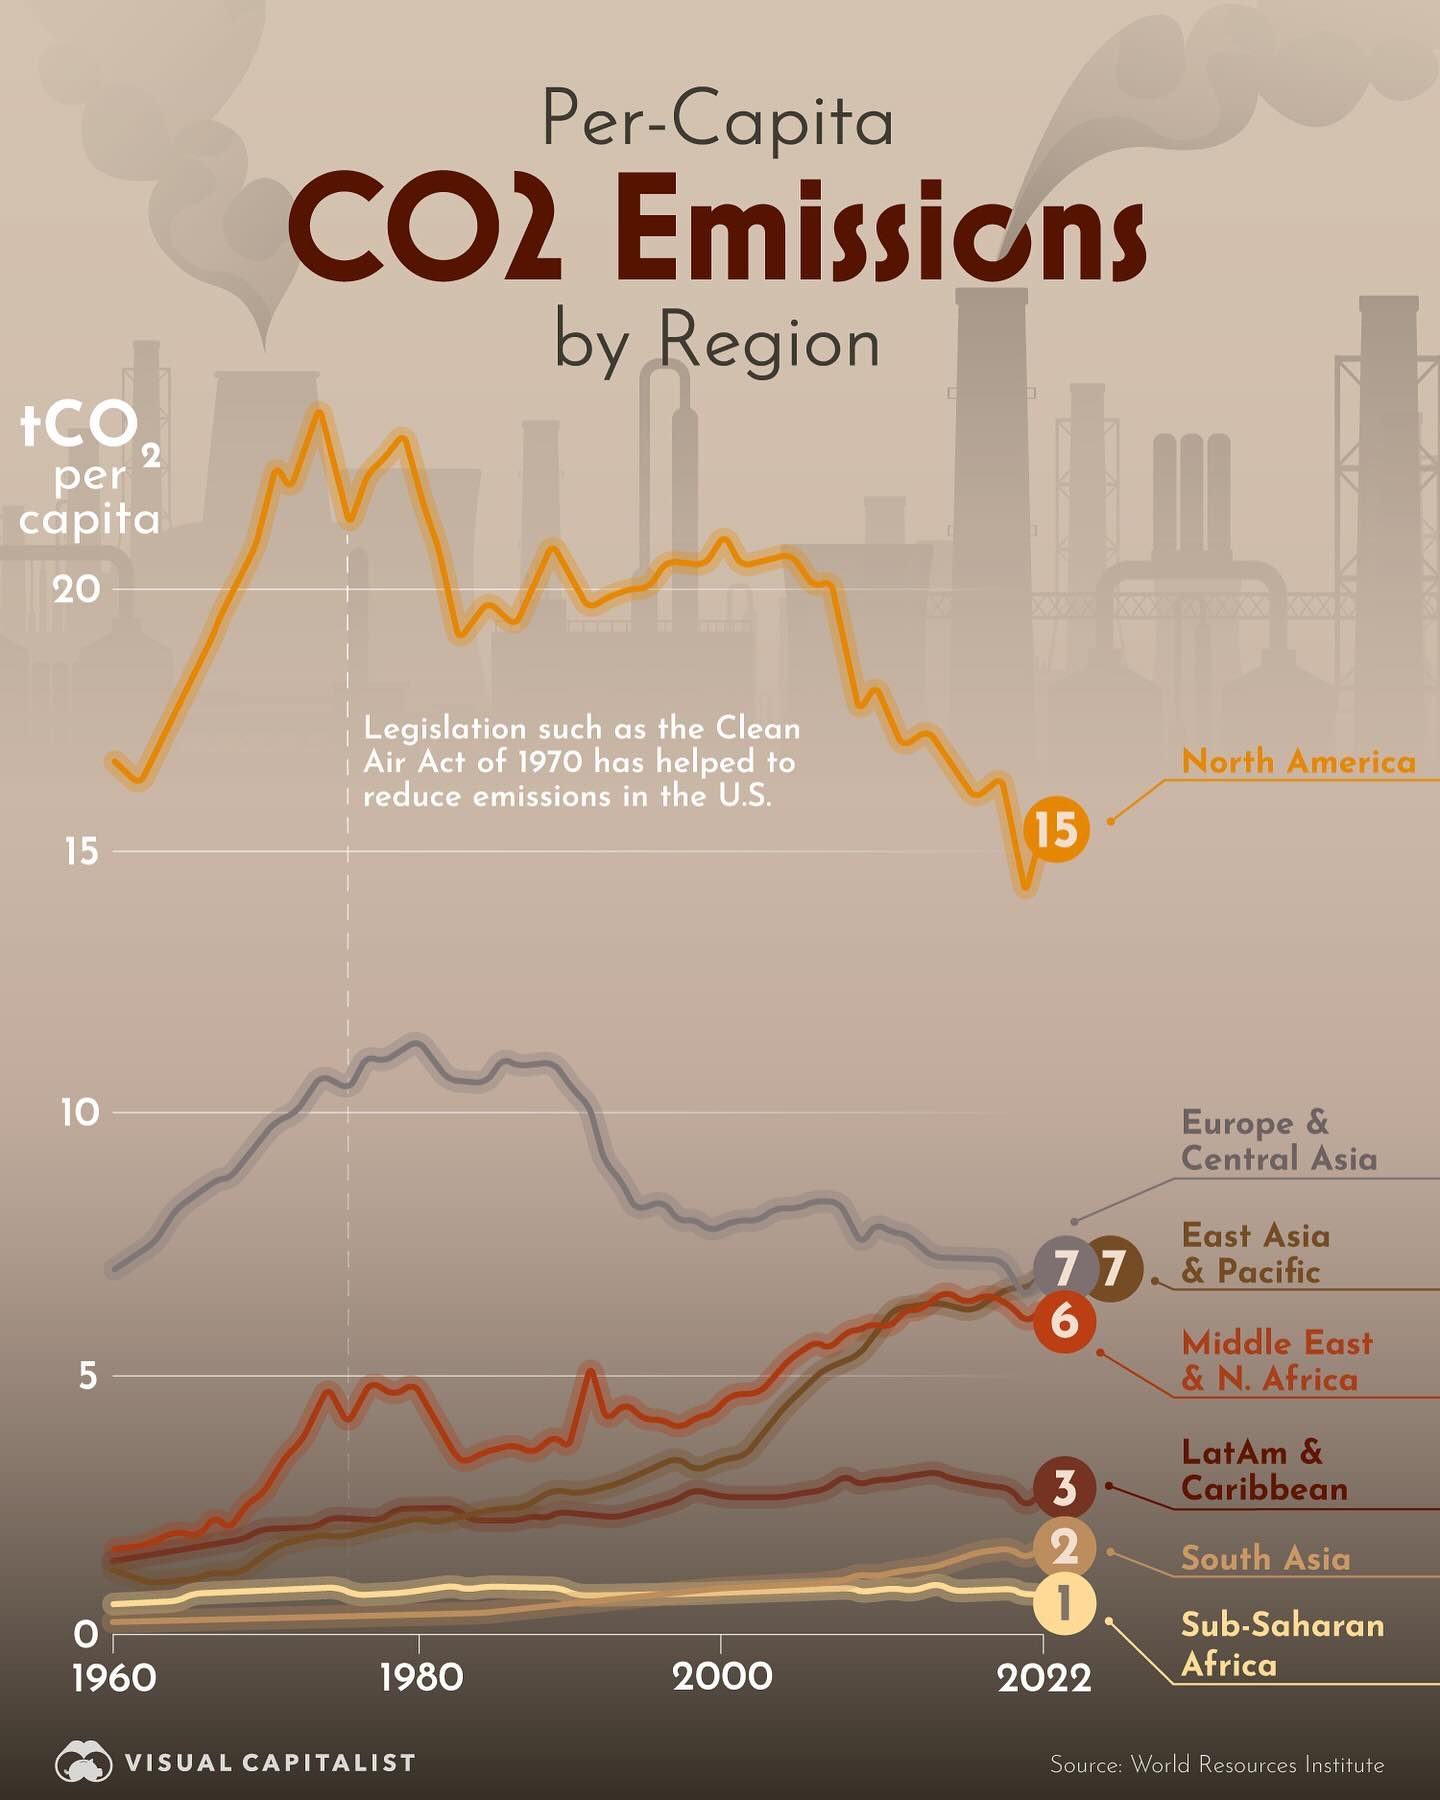
CO2 Emissions by Region
Per-capita CO2 emissions are a critical metric for understanding how different regions around the world contribute to global greenhouse gas production. North America, particularly the United States and Canada, has historically led the world in per-capita CO2 emissions since 1960. However, significant changes in technology, policy, and economic structure have driven a notable decline in emissions over the past two decades.
The data visualized here comes from Climate Watch, sourced from the World Resources Institute, and covers over 60 years of per-capita CO2 emissions by region. This infographic provides a clear, data-driven look at how different parts of the world have changed their carbon footprints.
Context / Why This Matters
Understanding the trends in per-capita CO2 emissions is crucial for several reasons. Firstly, it helps in tracking the progress of global climate efforts. By seeing how different regions have managed to reduce their emissions, we can identify what policies and technologies have been effective. Secondly, it provides a benchmark for future action, helping policymakers and environmental organizations set realistic and achievable goals for emission reduction.
Main Discussion
Historical Overview
Since 1960, North America has consistently topped the list of regions with the highest per-capita CO2 emissions. This dominance can be attributed to the region's industrialization and reliance on fossil fuels for energy. The Clean Air Act of 1970 played a pivotal role in curbing emissions in the U.S. By setting stricter air quality standards, this legislation spurred the adoption of cleaner technologies and practices.
Regional Trends
North America
North America, driven by the U.S. and Canada, has shown a mix of high emissions and significant reduction efforts. Key drivers of this reduction include a shift from heavy manufacturing to a service-based economy, advancements in clean energy technologies, and stricter environmental regulations.
Europe & Central Asia
Europe and Central Asia have also seen a decline in per-capita CO2 emissions, largely due to a stronger focus on renewable energy sources. Policy changes, such as the European Green Deal, have further accelerated this trend. Europe's efforts in promoting electric vehicles, solar energy, and wind power have been particularly impactful in reducing carbon footprints.
Asia
East Asia and the Pacific, a region that includes countries like China and Japan, has seen a surge in emissions, driven primarily by industrialization and urbanization. However, recent policies aimed at environmental sustainability, such as China's pledge to achieve net-zero emissions by 2060, indicate a potential shift towards a cleaner future.
The Middle East and North Africa have also seen fluctuating trends in emissions, influenced heavily by oil production and consumption. Efforts to diversify economies and invest in renewable energy sources are underway, though the progress varies significantly across different countries.
Latin America and the Caribbean
Latin America and the Caribbean have relatively lower per-capita emissions compared to other regions, though this varies widely within the region. Countries like Brazil have faced challenges due to deforestation and agriculture, while others like Chile and Costa Rica have made significant strides in renewable energy.
South Asia
South Asia, including countries like India and Pakistan, has seen steady growth in emissions, largely due to rapid industrialization and population growth. While challenges remain, initiatives focused on clean energy and sustainable development are gaining traction, particularly in countries like India.
Sub-Saharan Africa
Sub-Saharan Africa, despite having some of the lowest per-capita emissions globally, faces unique challenges such as deforestation and limited access to clean energy. Efforts to promote renewable energy sources and sustainable agricultural practices are crucial for the region to maintain low emissions while fostering economic growth.
The Impact of Policy and Technology
The decline in emissions observed in many regions is a direct result of policy changes and technological advancements. Legislation like the Clean Air Act of 1970 in the U.S. and the European Green Deal in Europe have set the stage for significant reductions. These policies, combined with innovations in renewable energy, electric vehicles, and energy-efficient technologies, have been instrumental in driving down emissions.
Practical Tips
For individuals and organizations looking to contribute to the reduction of CO2 emissions, several practical steps can be taken:
- Adopt Renewable Energy: Transitioning to renewable energy sources like solar, wind, and hydroelectric power can significantly reduce carbon footprints.
- Promote Energy Efficiency: Implementing energy-efficient practices in homes, businesses, and industries can cut down on energy consumption and emissions.
- Shift to Electric Vehicles: Electric vehicles (EVs) produce zero tailpipe emissions, making them a cleaner alternative to traditional fossil fuel-powered cars.
- Support Policy Changes: Advocating for policies that promote green technologies and enforce stricter emission standards can drive larger, systemic changes.
Important Takeaways
- North America, particularly the U.S. and Canada, has historically led in per-capita CO2 emissions but has shown significant reductions in recent decades.
- Policies and technological advancements, such as the Clean Air Act of 1970 and renewable energy innovations, have played a crucial role in emission reduction.
- Different regions have unique challenges and opportunities in reducing their carbon footprints, influenced by their economic structures, energy sources, and environmental policies.
- Sustainable practices and policy support are essential for continuing the downward trend in per-capita CO2 emissions.
Conclusion
Understanding the trends in per-capita CO2 emissions by region is essential for gauging global progress in climate change mitigation. The data from Climate Watch, via the World Resources Institute, provides valuable insights into how different regions have managed their emissions over the past six decades. By highlighting the success stories and challenges, we can better understand what works and what doesn't in the fight against climate change. Moving forward, continued efforts in policy reform, technological innovation, and sustainable practices are vital for achieving long-term emission reduction goals.
Watch the Reel
Questions readers ask
What are per-capita CO2 emissions and why are they important?
Per-capita CO2 emissions refer to the average amount of carbon dioxide released into the atmosphere per person in a given region or country. This metric is crucial for understanding individual contributions to global greenhouse gas production and allows for meaningful comparisons between regions with different population sizes.
How have North America's per-capita CO2 emissions changed since 1960?
Since 1960, North America's per-capita CO2 emissions have seen significant fluctuations. While the region historically led in per-capita emissions, there has been a notable decline over the past two decades. This shift is attributed to advancements in technology, policy changes, and shifts in economic structure.
Which countries in North America have the highest per-capita CO2 emissions?
The United States and Canada have consistently been at the top of the list for per-capita CO2 emissions in North America. These countries have both seen significant changes in their emission levels, with notable declines in the past two decades due to various technological and policy initiatives.
What factors have contributed to the decline in North America's per-capita CO2 emissions?
The decline in North America's per-capita CO2 emissions can be attributed to several factors, including the adoption of cleaner energy technologies, implementation of emission reduction policies, and shifts in the economic structure towards less fossil-fuel intensive industries.
How do North America's CO2 emissions compare to other regions globally?
North America has historically had one of the highest per-capita CO2 emissions compared to other regions. However, the recent decline in emissions has narrowed the gap. Other regions, particularly those with rapid industrialization, may still have rising emissions, making it essential to track global trends for effective climate mitigation strategies.
What are the main sources of CO2 emissions in North America?
The primary sources of CO2 emissions in North America include power generation, transportation, and industrial activities. Efforts to reduce emissions in these sectors have been a significant focus of policy and technological advancements in the region.
Why is tracking per-capita CO2 emissions important for global climate efforts?
Tracking per-capita CO2 emissions is essential for understanding and addressing global climate change. It helps identify regions that contribute most to greenhouse gas emissions and sets a benchmark for emission reduction goals, allowing for targeted efforts to mitigate climate impacts.
Related deep dives
Similar reads based on topic and creator.


Recent articles
Fresh deep dives from the latest Reels we unpacked.




Comments
Be the first to comment.