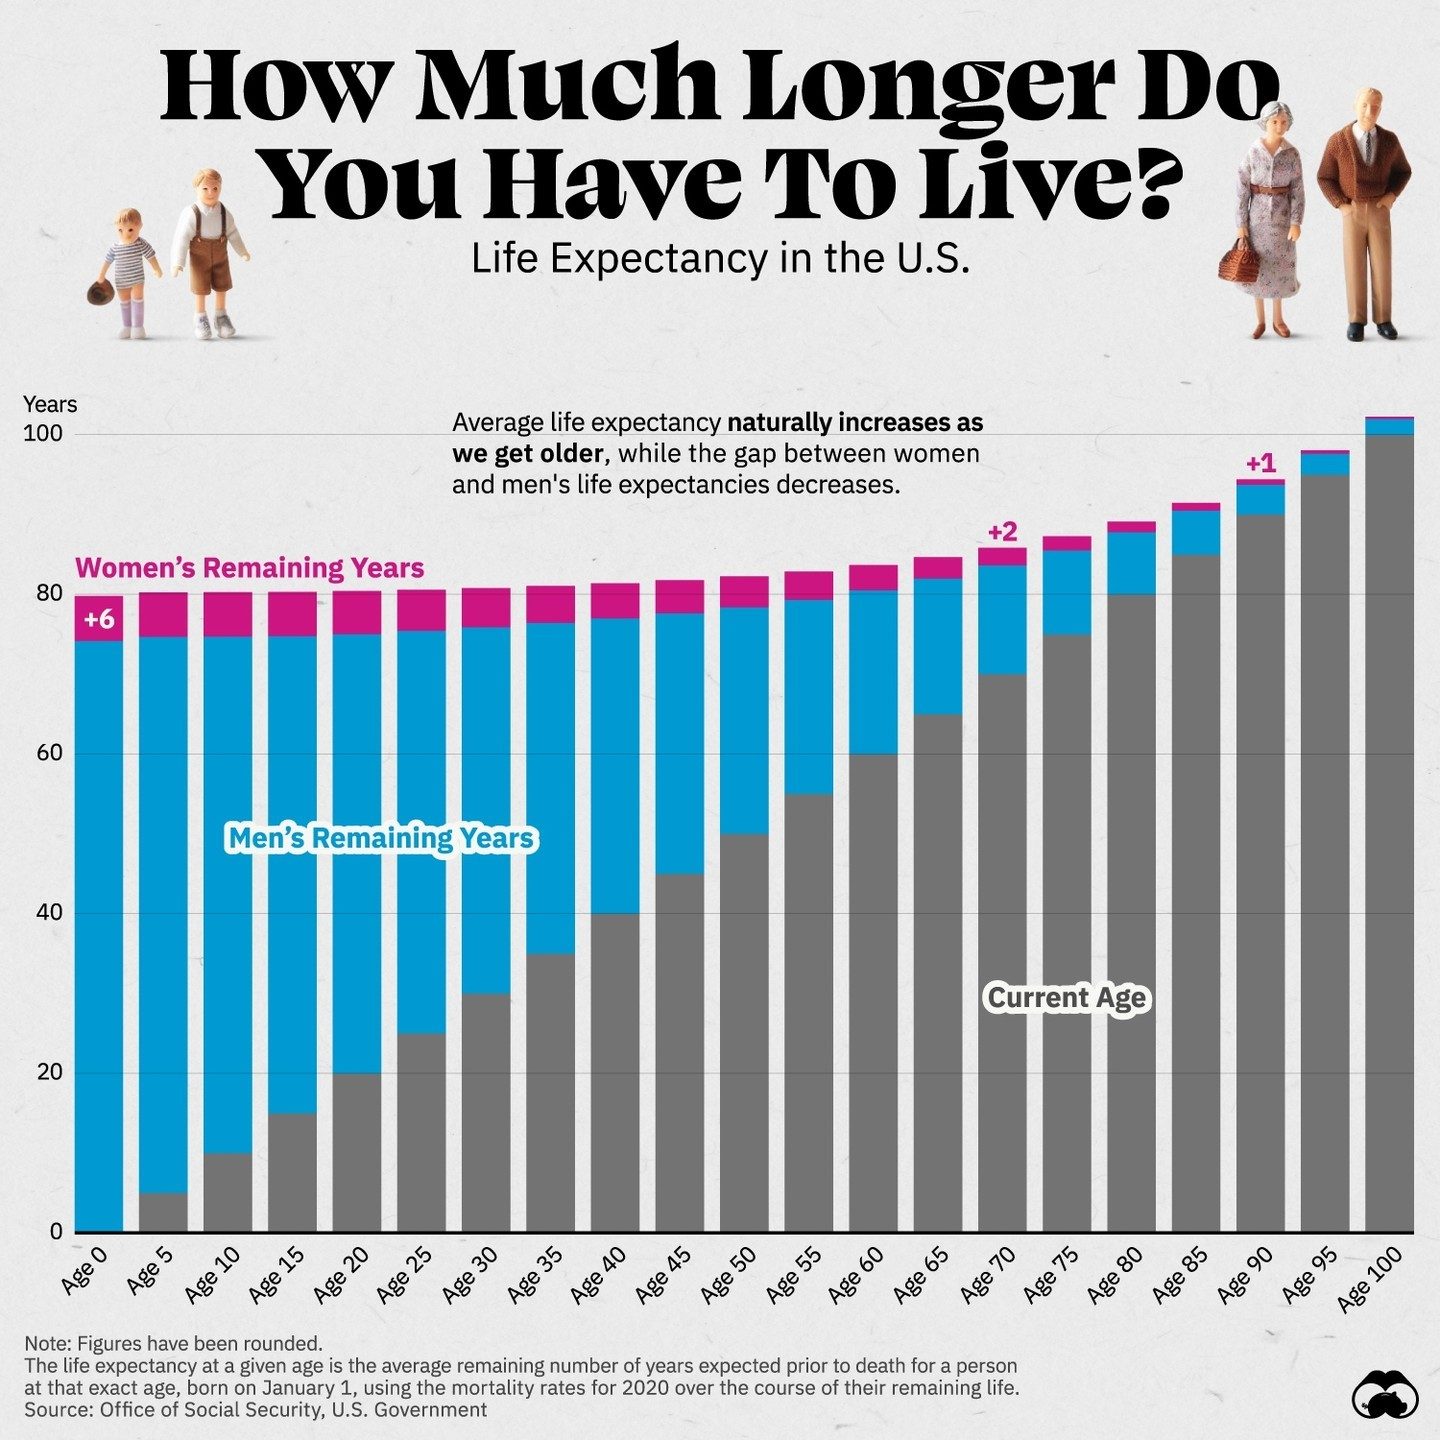
Life Expectancy in the U.S.
At the start of the 19th century, global life expectancy at birth was around 29 years. Since then, significant improvements in nutrition, healthcare, and sanitation have led to a substantial increase in life expectancy across all ages. This article explores life expectancy in the U.S. by age and gender, using data from the Office of Social Security, which bases their current projections on 2020 mortality rates.
Why This Matters
Understanding life expectancy is crucial for various reasons, from personal planning to public health policy. Life expectancy data helps inform decisions about retirement, healthcare needs, and societal infrastructure. It also provides insights into the overall health and well-being of the population, highlighting areas where further improvements can be made.
Life Expectancy Trends
Historical Perspective
Life expectancy has seen remarkable improvements over the past two centuries. At the dawn of the 19th century, the average lifespan was just 29 years. This low figure can be attributed to high infant mortality rates, limited medical knowledge, and poor living conditions. As the 19th century progressed, advancements in medical science, improved sanitation, and better nutrition began to extend life expectancy.
Modern Improvements
Since the 1920s, life expectancy has continued to improve significantly. According to the Office of Social Security, the data used for these projections is based on 2020 mortality rates. This means that the life expectancy figures reflect the most recent and relevant data available.
The infographic shared highlights the average remaining years for both men and women at different ages. These visualizations are based on the premise that life expectancy at a given age is the average remaining number of years prior to death for a person at that exact age, using the mortality rates from 2020.
Life Expectancy by Age and Gender
The infographic shows that life expectancy naturally increases as we get older. For example, at age 5, the average remaining years for women and men are higher than at birth. As people age, the gap between women's and men's life expectancies decreases. This trend is evident in the bar graphs, which illustrate the data clearly.
Data Source and Calculation
The data used in the infographic comes from the Office of Social Security, a branch of the U.S. Government. The life expectancy at a given age is calculated as the average remaining number of years prior to death for a person at that exact age, born on January 1, using the mortality rates for 2020 over the course of their remaining life.
Factors Influencing Life Expectancy
Nutrition and Healthcare
Advancements in nutrition and healthcare have been pivotal in extending life expectancy. Improved diets and access to medical care have led to a significant reduction in mortality rates from various diseases. For instance, the development of vaccines and antibiotics has eradicated or controlled many infectious diseases that were once leading causes of death.
Sanitation and Public Health
Sanitation and public health initiatives have also played a crucial role. Clean water, improved waste management, and better living conditions have led to a drastic reduction in waterborne and airborne diseases. These improvements have contributed to a healthier population with longer life spans.
Lifestyle Choices
Lifestyle choices, such as regular exercise, healthy eating, and avoiding harmful habits like smoking and excessive alcohol consumption, also significantly impact life expectancy. People who adopt healthier lifestyles tend to live longer and have a better quality of life.
Practical Tips
While the data provides a broad overview, there are practical steps individuals can take to potentially extend their life expectancy:
Regular Check-Ups
Regular medical check-ups can help detect health issues early, allowing for timely intervention and treatment. This proactive approach to healthcare can significantly improve long-term health outcomes.
Balanced Diet
A balanced diet rich in fruits, vegetables, lean proteins, and whole grains can provide the necessary nutrients to support a healthy body. Avoiding processed foods, sugars, and unhealthy fats is also crucial.
Physical Activity
Regular physical activity is essential for maintaining good health. Aim for at least 150 minutes of moderate-intensity or 75 minutes of vigorous-intensity aerobic activity per week, along with strength training exercises at least two days a week.
Mental Health
Mental health is as important as physical health. Practices such as meditation, mindfulness, and stress management techniques can help improve mental well-being, which in turn can positively impact overall health.
Avoid Harmful Substances
Avoiding harmful substances like tobacco and excessive alcohol can significantly improve life expectancy. These substances are known to increase the risk of various diseases, including cancer, heart disease, and liver disease.
Important Takeaways
Life expectancy in the U.S. has seen remarkable improvements over the past two centuries, thanks to advancements in nutrition, healthcare, and sanitation. The data from the Office of Social Security provides valuable insights into life expectancy by age and gender, highlighting the average remaining years for different age groups.
Understanding these trends can help individuals make informed decisions about their health and well-being. Regular medical check-ups, a balanced diet, physical activity, and mental health practices can all contribute to a longer, healthier life.
Conclusion
Life expectancy is a dynamic measure that reflects the overall health and well-being of a population. By understanding the factors that influence life expectancy and taking proactive steps to improve personal health, individuals can contribute to a longer, more fulfilling life.
While current data shows significant improvements, continuous efforts in public health, medical research, and individual lifestyle choices are necessary to further extend life expectancy and improve the quality of life for all.
Watch the Reel
Questions readers ask
How does life expectancy in the U.S. vary between men and women?
Life expectancy in the U.S. tends to be higher for women than for men. On average, women live about 5 years longer than men. This difference is attributed to a combination of biological, environmental, and behavioral factors.
What is the average remaining years of life for a 65-year-old in the U.S.?
According to the Office of Social Security, a 65-year-old man in the U.S. can expect to live an additional 18.3 years, while a 65-year-old woman can expect to live an additional 20.9 years. These figures are based on 2020 mortality rates.
How has life expectancy in the U.S. changed over time?
Life expectancy in the U.S. has seen a significant increase over the past two centuries. In the early 19th century, life expectancy at birth was around 29 years. Today, it has risen to approximately 78.9 years, reflecting improvements in healthcare, nutrition, and sanitation.
Which age group has the most significant life expectancy gain in the U.S.?
Life expectancy gains have been substantial across all age groups, but the most significant improvements have been seen in infancy and childhood. This is largely due to advancements in medical care and reductions in infant mortality rates.
How can life expectancy data be useful for personal planning?
Life expectancy data provides valuable insights for personal financial planning. By understanding the average remaining years of life, individuals can make informed decisions about retirement savings, healthcare needs, and long-term care planning.
What factors influence life expectancy trends in the U.S.?
Several factors influence life expectancy trends, including advancements in medical technology, improvements in healthcare access, changes in lifestyle behaviors, and public health initiatives. Additionally, socioeconomic factors such as income and access to healthcare play a significant role.
How accurate are life expectancy projections based on 2020 mortality rates?
Life expectancy projections based on 2020 mortality rates provide a reasonable estimate of current trends. However, it's important to note that life expectancy can fluctuate due to unforeseen events, such as pandemics or significant advances in medical treatment. Therefore, projections should be considered as estimates rather than definitive predictions.
Related deep dives
Similar reads based on topic and creator.


Recent articles
Fresh deep dives from the latest Reels we unpacked.




Comments
Be the first to comment.