Data Storytelling: Unlocking Complex Ideas
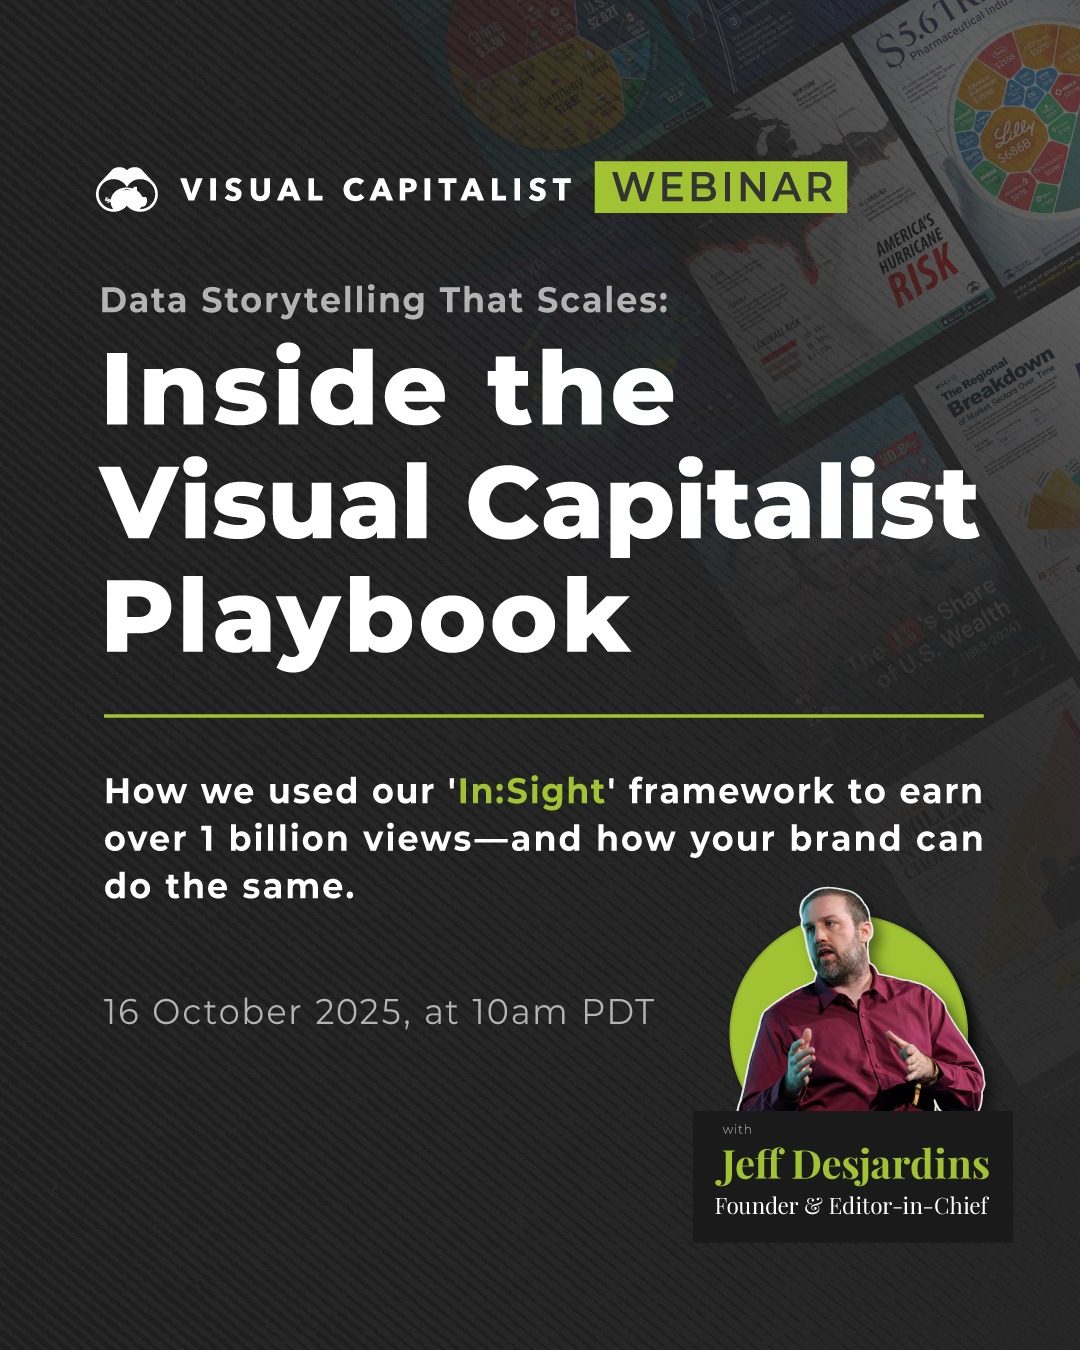
Data storytelling is an art and science that can transform raw data into compelling narratives. It's a powerful tool used by global brands to communicate complex ideas effectively. This skill is crucial for any organization aiming to drive engagement and action through visual content. Visual Capitalist, a leader in data visualization, is hosting a webinar to delve into the intricacies of this field.
Why This Matters
Effective communication is essential for any organization. Data storytelling allows brands to turn abstract data into engaging visuals that resonate with audiences. It’s a key aspect of modern marketing, serving as a bridge between complex data and actionable insights. By mastering data storytelling, brands can create content that not only informs but also inspires their audience.
The Essence of Data Storytelling
Understanding the 'In:Sight' Framework
Visual Capitalist's upcoming webinar will focus on their unique 'In:Sight' framework. This framework has enabled them to earn over 1 billion views—a testament to its effectiveness. The framework is designed to help brands create visuals that are both informative and engaging. It combines the principles of data visualization, storytelling, and design to deliver impactful content.
Key Elements of Data Storytelling
To understand how to apply data storytelling effectively, it’s important to break down its key elements:
- Data Visualization: This is the process of transforming data into a visual format. It allows audiences to understand complex data points more easily. Tools like charts, graphs, and infographics are commonly used.
- Storytelling: The narrative aspect ties together the data points into a cohesive and engaging story. This makes the data more relatable and memorable.
- Design: Aesthetic appeal is crucial. Good design ensures that the visuals are not only informative but also visually appealing, which can capture and hold the audience's attention.
The Impact of Data Storytelling
The power of data storytelling lies in its ability to inspire action. By combining data with a compelling narrative, brands can drive their audience to take specific actions, whether it’s making a purchase, signing up for a newsletter, or sharing content with others. Effective data storytelling can lead to:
- Higher Engagement Rates: Visually appealing and engaging content is more likely to capture and retain audience attention.
- Increased Trust: Transparent and clear data presentation builds trust with the audience.
- Better Decision Making: Well-presented data can guide audiences and organizations in making more informed decisions.
Practical Tips for Effective Data Storytelling
While the upcoming webinar will dive deeper into these techniques, here are some practical tips to get you started:
Know Your Audience
Understanding your audience is the first step. Tailor your data storytelling to their interests, knowledge level, and preferences. This ensures that your content is relevant and resonates with them.
Choose the Right Visuals
Select visuals that best represent your data. For example, use bar charts for comparisons, line charts for trends, and pie charts for proportions. Ensure that the visuals are clear and easy to understand.
Keep It Simple
Avoid overwhelming your audience with too much information. Keep your visuals clean and uncluttered. Use a consistent color scheme and design elements to make the content more cohesive.
Create a Compelling Narrative
Develop a story that ties together your data points. Use a clear introduction, body, and conclusion to guide your audience through the narrative. This structure helps in maintaining their interest and understanding.
Use Interactive Elements
Interactive visuals, such as clickable charts or animations, can make your data storytelling more engaging. These elements allow your audience to explore the data at their own pace, enhancing their overall experience.
Important Takeaways
The art of data storytelling is not just about presenting data; it’s about creating a narrative that inspires action. By leveraging tools like the 'In:Sight' framework, brands can transform raw data into engaging content. Effective data storytelling can lead to higher engagement rates, increased trust, and better decision-making.
Conclusion
Data storytelling is a powerful tool for communicating complex ideas in an engaging and effective manner. It's a skill that can drive action and engagement within your organization. By attending the Visual Capitalist webinar, you can gain insights into how to create visuals that resonate, engage, and inspire action. Whether you're a marketer, designer, or data analyst, mastering data storytelling is essential for success in today's data-driven world.
Watch the Reel
Questions readers ask
What is data storytelling and why is it important for brands?
Data storytelling is the process of transforming raw data into engaging narratives and visuals. It's crucial for brands as it helps to communicate complex ideas in a digestible and compelling way, driving audience engagement and encouraging action. By using data storytelling, brands can stand out in a crowded digital landscape and foster a deeper connection with their audience.
Who is Jeff Desjardins and what is his role in data storytelling?
Jeff Desjardins is the founder of Visual Capitalist, a company known for creating engaging visual content and data-driven stories. As a pioneer in data visualization, Desjardins offers insights into the art of data storytelling, making complex information accessible and appealing to a wide audience. His expertise can guide brands in crafting powerful narratives that resonate with their audience.
What can I expect to learn from the Visual Capitalist data storytelling webinar?
The Visual Capitalist data storytelling webinar is designed to provide attendees with a deep dive into the techniques and strategies used to create compelling data narratives. Participants can expect to learn about visual storytelling techniques, best practices for data visualization, and practical tips for turning raw data into engaging content. It's an opportunity to gain insights from industry experts and enhance your ability to captivate your audience.
How can data storytelling help drive audience engagement and action?
Data storytelling helps drive audience engagement and action by making complex information relatable and visually appealing. Through engaging narratives, brands can captivate their audience, making it easier to convey key messages and inspire action. By transforming raw data into compelling stories, brands can create content that not only informs but also motivates viewers to engage with the brand or take specific actions.
What are some essential tips for effective data storytelling?
Some essential tips for effective data storytelling include using clear and concise language, choosing the right visuals to support your narrative, and ensuring that your data is accurate and relevant. It's also important to know your audience and tailor your story to their interests and needs. Combining these elements will help create a powerful and engaging narrative that resonates with your audience.
Why is data storytelling expected to be more important by 2025?
By 2025, data storytelling is expected to be even more important due to the increasing amount of data generated and the need for brands to stand out. As digital content continues to grow, brands will need to leverage data storytelling to cut through the noise and effectively engage their audiences. Mastering this skill will be essential for brands aiming to communicate complex ideas and drive meaningful actions in the future.
Recent articles
Fresh deep dives from the latest Reels we unpacked.




Comments
Be the first to comment.