Comparing International Income Levels
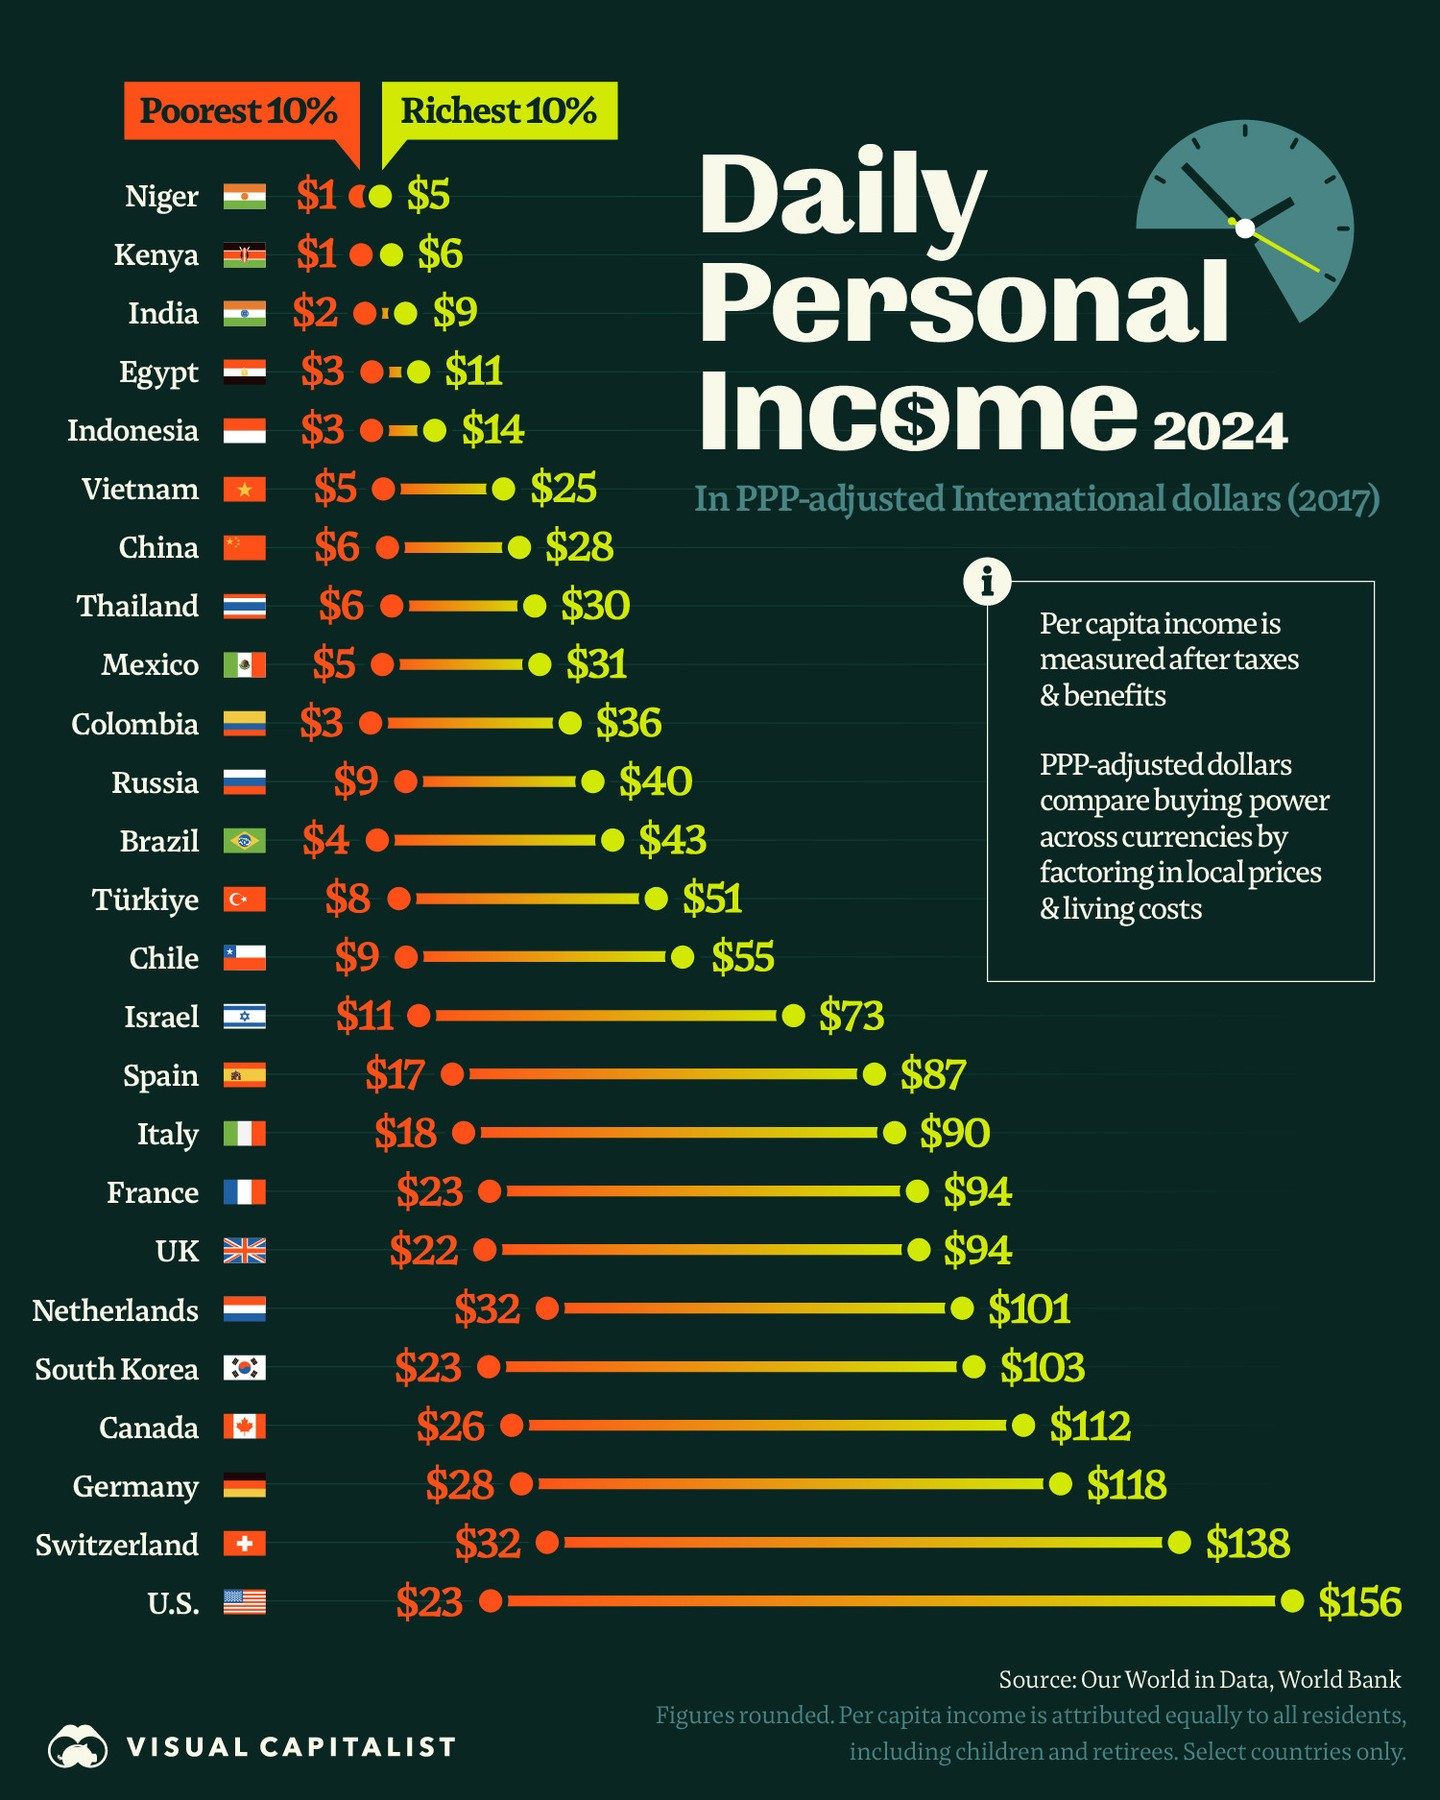
In 2024, the income disparities between countries highlighted stark differences. The richest 10% of Americans, for instance, earned an average of $156 per day, nearly seven times more than the bottom 10% in the U.S. Surprisingly, the bottom 10% in the U.S. still earn more than the top 10% in many countries, including Indonesia, Egypt, and India.
Income Inequality: Why This Matters
Understanding global income inequality is crucial for grasping the economic landscape. Income disparities significantly influence living standards, access to resources, and overall economic stability. By examining daily personal income in 2024, we gain insights into the economic health and purchasing power of various populations.
Global Income Comparison
Daily Personal Income in 2024
Daily personal income figures provide a clear picture of economic disparities. The data, sourced from Our World in Data and the World Bank, is presented in PPP-adjusted international dollars (2017 prices). This adjustment ensures a fair comparison by factoring in purchasing power parity (PPP), which accounts for differences in prices and living costs across countries.
Income Levels by Region
- United States: The income gap within the U.S. is substantial. The richest 10% earned $156 per day, while the bottom 10% earned significantly less.
- Asia: Countries like Indonesia and India show lower income levels compared to the U.S. The top 10% in these countries earn less than the bottom 10% in the U.S.
- Africa: Egypt, for instance, has income levels comparable to some of the lower-income Asian countries. The top 10% in Egypt earn less than the bottom 10% in the U.S.
- Europe and Other Regions: Data from Europe and other regions show varying income levels, with some countries having higher incomes than others. Countries like Norway and Switzerland have some of the highest income levels globally.
Per Capita Income and PPP
Per capita income is attributed equally to all residents, providing a standardized measure of economic performance. PPP-adjusted figures compare buying power across currencies by factoring in local prices and living costs. This method ensures that income comparisons are fair and accurate, reflecting the true economic disparities between countries.
Practical Tips for Understanding Global Income Data
Comparing Income Levels
When comparing income levels, it's essential to consider the cost of living. PPP-adjusted figures provide a more accurate comparison by accounting for differences in prices and living costs. For example, while a higher income might seem impressive, it's essential to consider how far that income goes in terms of purchasing power.
Interpreting Data Sources
Data from reputable sources like Our World in Data and the World Bank is reliable and widely used in economic research. Understanding the methodologies behind these data sources can help in interpreting the information accurately. For instance, knowing that figures are rounded and adjusted for PPP can provide context for the data presented.
Recognizing Income Disparities
Income disparities are a global issue, and recognizing them is the first step toward addressing them. Whether within a country or between countries, understanding these disparities can inform policies aimed at reducing inequality and improving economic stability.
Data Visualization
Visualizations, such as bar graphs, can make complex data more accessible. By representing daily personal income with flags and corresponding bars, viewers can quickly grasp the income levels of different countries. This visual approach helps in understanding the data intuitively.
Important Takeaways
- Income Disparities: There are significant income disparities within and between countries. The U.S., for example, shows a substantial income gap, with the richest earning much more than the poorest.
- PPP-Adjusted Figures: PPP-adjusted figures provide a fair comparison by accounting for differences in prices and living costs.
- Global Variations: Income levels vary widely across regions, with some countries in Asia and Africa having lower incomes compared to the U.S.
Conclusion
Examining global income levels in 2024 reveals stark disparities that highlight the economic challenges faced by different populations. By understanding daily personal income in PPP-adjusted international dollars, we gain valuable insights into the economic landscape and purchasing power of various countries. Recognizing these disparities is crucial for developing policies aimed at reducing inequality and improving economic stability. Whether within a country or between countries, the data underscores the need for continued efforts to address income disparities and enhance economic well-being globally.
Watch the Reel
Questions readers ask
What is the daily income of the richest 10% of Americans in 2024?
In 2024, the richest 10% of Americans earn an average of $156 per day. This figure is notably higher than the daily income of many other countries' populations, highlighting significant global income disparities.
How does the bottom 10% of U.S. income earners compare to other countries?
The bottom 10% of U.S. income earners make more than the top 10% in several countries, including Indonesia, Egypt, and India. This comparison underscores the vast differences in living standards and economic conditions around the world.
Why is understanding global income inequality important in 2024?
Understanding global income inequality in 2024 is important because it provides insights into living standards, resource access, and economic stability. By examining daily personal income, we can gauge the economic health and purchasing power of various populations.
What are some of the lowest income countries in 2024?
Some of the lowest income countries in 2024 include Indonesia, Egypt, and India, where the top 10% of earners make less than the bottom 10% in the United States. These countries face significant economic challenges and lower living standards.
What is the significance of comparing daily income across different countries?
Comparing daily income across different countries in 2024 helps illustrate the vast disparities in living standards and economic conditions. It provides a clear picture of how much people earn and what they can afford, offering a snapshot of global economic health.
How does PPP income data help in understanding global income distribution in 2024?
PPP (Purchasing Power Parity) income data helps in understanding global income distribution by adjusting for differences in the cost of living between countries. This allows for a more accurate comparison of living standards and economic conditions across different nations in 2024.
What trends are observed in international income comparisons for 2024?
In 2024, international income comparisons reveal stark disparities, with the richest 10% of Americans earning significantly more than many other countries' populations. This trend highlights a growing gap in living standards and economic conditions, with implications for global economic stability.
Related deep dives
Similar reads based on topic and creator.


Recent articles
Fresh deep dives from the latest Reels we unpacked.




Comments
Be the first to comment.