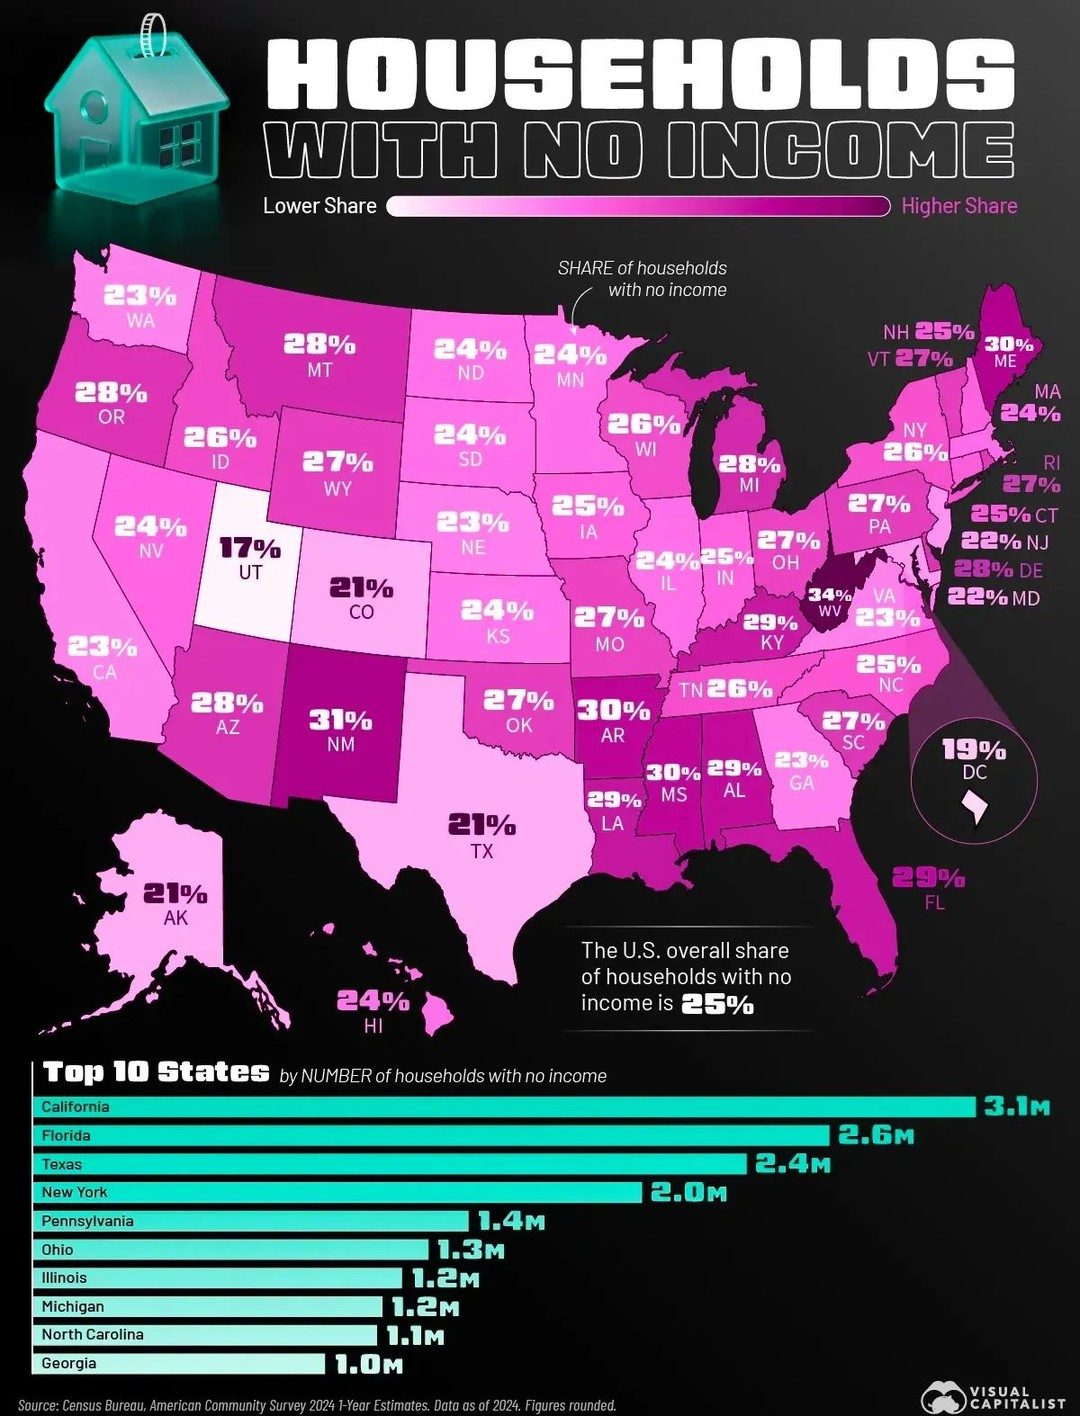
Household Income Disparity in the U.S. States
Household income disparity is a significant economic issue across the United States. The variation in the share of households with no income highlights the economic challenges faced by different states. Understanding this disparity is crucial for addressing economic policies and social welfare programs.
Why This Matters
The distribution of household income across the U.S. provides insights into the economic health and inequality within the country. States with a higher percentage of no-income households may face unique challenges, including higher poverty rates, limited access to essential services, and a greater need for economic support. Conversely, states with lower percentages might have more robust economic infrastructures and better social safety nets.
Key Findings and Analysis
State-by-State Breakdown
The data from the U.S. Census Bureau's American Community Survey for 2024 reveals that West Virginia has the highest share of households with no income at 34%, while Utah has the lowest at 17%. This significant difference underscores the wide economic disparities across the country.
Highest No-Income Households
-
West Virginia (34%): This state leads the nation in the proportion of households with no income, indicating a pressing need for economic support and development. Factors contributing to this high percentage might include limited job opportunities, lower median income, and higher rates of unemployment.
-
Colorado (31%): Colorado is another state with a substantial share of no-income households. This could be due to a combination of high living costs and a significant number of part-time or gig economy workers who may not report consistent income.
Lowest No-Income Households
- Utah (17%): Utah has the lowest percentage of no-income households, suggesting a more robust economy with better job opportunities and higher incomes. The state's economic policies and industry diversification may contribute to this favorable statistic.
Clustered Mid-Range States
Most states fall within the mid-20s percentage range for no-income households. This clustering indicates a common experience of economic challenges across the country. Some notable states in this range include:
-
Idaho (24%): Idaho has a moderate percentage of no-income households, reflecting its mixed economic landscape with both urban and rural areas.
-
Tennessee (26%): Tennessee's mid-range percentage suggests a balanced economic situation, with a mix of industrial and service-based economies.
Notable Mentions
- New York and Pennsylvania: These states have significant numbers of households with no income, with New York leading at 2.6 million and Pennsylvania close behind at 1.4 million. Both states face considerable economic challenges, especially in urban areas.
OCR Text Highlights
The on-screen text from the visualization provides specific percentages for each state:
- Washington (23%)
- Montana (28%)
- Idaho (24%)
- Nevada (23%)
- Utah (28%)
- Colorado (31%)
- Kansas (24%)
- Missouri (27%)
- Tennessee (26%)
- North Carolina (25%)
- District of Columbia (19%)
- Alaska (21%)
- Oklahoma (24%)
- Arkansas (30%)
- Louisiana (29%)
- Florida (27%)
- Maine (25%)
- Vermont (27%)
- Pennsylvania (24%)
- Ohio (28%)
- Wisconsin (26%)
- Illinois (28%)
- Connecticut (25%)
- Maryland (22%)
- Massachusetts (27%)
- Rhode Island (23%)
- Minnesota (26%)
- North Dakota (27%)
Top 10 States by Number of Households with No Income
- New York (2.6 million)
- Pennsylvania (1.4 million)
- Illinois (1.3 million)
- Michigan (1.2 million)
- North Carolina (1.0 million)
The Overall Picture
The U.S. overall share of households with no income is 25%, highlighting the widespread nature of this issue. This means that one in four households in the U.S. does not report any income, a statistic that underscores the need for comprehensive economic policies aimed at reducing inequality.
Practical Tips for Addressing Household Income Disparity
Economic Policy Recommendations
-
Incentivize Employment: Policies that encourage job creation and provide incentives for businesses to hire can help reduce the number of no-income households. Tax breaks and subsidies for companies that create jobs in high-poverty areas can be particularly effective.
-
Invest in Education and Training: Enhancing access to education and vocational training programs can equip individuals with the skills needed to secure higher-paying jobs. This includes investing in community colleges, vocational schools, and apprenticeship programs.
-
Support for Small Businesses: Offering grants, loans, and other forms of financial support to small businesses can foster economic growth and create more job opportunities. Small businesses are often the backbone of local economies and can have a significant impact on reducing income disparities.
Social Welfare Programs
-
Expand Social Safety Nets: Strengthening social welfare programs, such as food assistance, housing subsidies, and healthcare, can provide immediate relief to households with no income. This includes expanding eligibility criteria and increasing benefit amounts.
-
Targeted Assistance: Implementing programs that specifically target households with no income can ensure that support is directed to those who need it most. This might involve providing financial aid, job training, and other resources tailored to the needs of these households.
Community Initiatives
-
Local Economic Development: Encouraging local economic development initiatives can help stimulate local economies and create job opportunities. This can involve community-based projects, local business incubators, and partnerships between local governments, non-profits, and businesses.
-
Community Support Networks: Building strong community support networks can provide immediate help to households in need. This includes community gardens, food banks, and other local initiatives that offer resources and support to those facing economic hardship.
Important Takeaways
The data on household income disparity across U.S. states highlights the urgent need for targeted economic policies and social welfare programs. The wide variation in the share of no-income households underscores the complex economic challenges faced by different regions. By understanding these disparities and implementing effective strategies, policymakers, businesses, and communities can work together to reduce income inequality and improve the economic well-being of all Americans.
Conclusion
Addressing household income disparity is a multifaceted challenge that requires a coordinated effort from policymakers, businesses, and communities. By leveraging economic incentives, investing in education and training, and expanding social welfare programs, we can work towards a more equitable future. Understanding the specific challenges faced by each state and tailoring solutions to meet their unique needs is essential for achieving lasting change.
Watch the Reel
Questions readers ask
Which states have the highest and lowest percentages of households with no income in 2024?
In 2024, West Virginia has the highest percentage of households with no income, at 34%. On the other end, Utah has the lowest percentage, at 17%.
What data source provides the most accurate information on household income by state for 2024?
The American Community Survey (ACS) 2024, conducted by the U.S. Census Bureau, is the most accurate and comprehensive source of information on household income by state for 2024. The ACS provides detailed income estimates that reflect the current economic landscape.
How does household income disparity relate to poverty rates across different states?
Household income disparity is closely linked to poverty rates. States with a higher percentage of households with no income, such as West Virginia, tend to have higher poverty rates and may face challenges in providing essential services to their residents. Conversely, states with lower percentages, like Utah, often have more robust economic infrastructures and better access to services.
What are the key factors contributing to income disparity across U.S. states in 2024?
Key factors contributing to income disparity across U.S. states in 2024 include variations in economic opportunities, job markets, and regional cost of living. Additionally, state-specific policies, industrial compositions, and educational and skill levels of the workforce play significant roles in shaping income disparity.
Are there any online tools to visualize the income disparity across U.S. states for 2024?
Yes, there are several online tools and resources that provide visualizations of income disparity across U.S. states for 2024. The U.S. Census Bureau's website offers interactive maps and charts based on the American Community Survey data, which can help users understand the distribution of household income and the economic challenges faced by different states.
Recent articles
Fresh deep dives from the latest Reels we unpacked.




Comments
Be the first to comment.