S&P 500 Rate Cuts and Returns
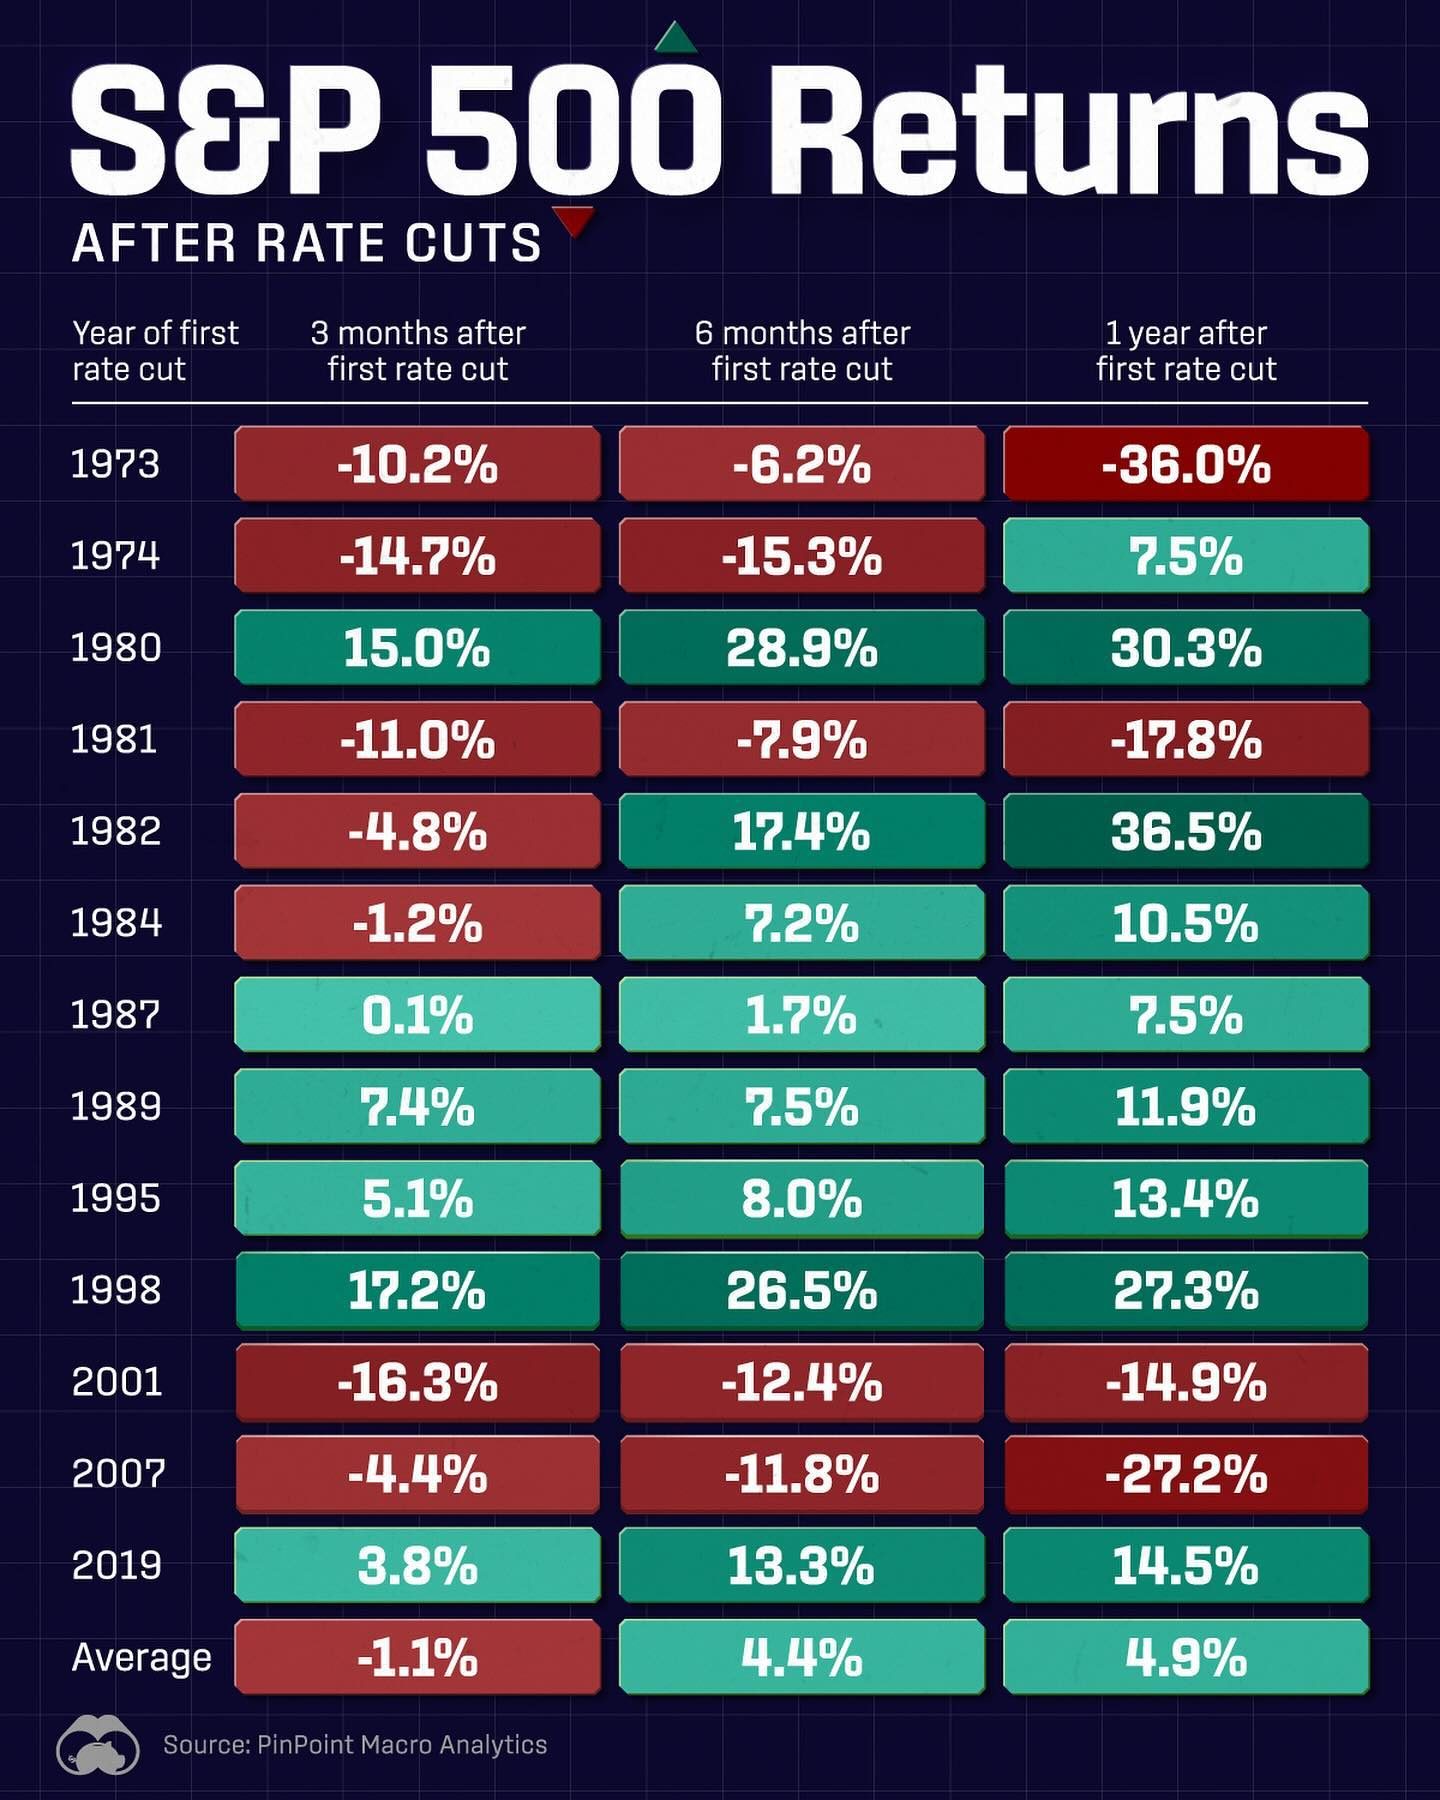
Understanding the performance of the S&P 500 in relation to interest rate cuts is crucial for investors seeking to navigate market dynamics. Historically, the S&P 500 has shown a tendency to return positive averages after the first interest rate cut, with notable variations across different cycles.
Context / Why this Matters
Interest rate cuts by the Federal Reserve can significantly impact the stock market. By lowering the cost of borrowing, rate cuts can stimulate economic activity, which often translates into increased corporate earnings and higher stock prices. Investors closely watch these rate changes as they can influence investment strategies and market sentiment.
Main Discussion
Historical Performance
Examining the data from PinPoint Macro Analytics, we can see that the S&P 500 has posted positive returns in the majority of rate cut cycles since 1973. The average return one year after the first rate cut is 4.9%. This figure highlights a general trend of market recovery and growth following rate reductions.
Key Cycles
-
1973 and 1974: The 1973 cycle started with a significant drop of -14.7% three months after the rate cut, but by one year later, the returns had improved to 7.5%. The 1974 cycle, however, showed stronger recovery, with returns of 30.3% one year after the first rate cut.
-
1980s: The early 1980s cycles are notable for their volatility. For instance, the 1980 cycle saw a negative return of -17.8% one year after the rate cut, while the 1981 cycle recovered with a substantial return of 36.5% one year later. The 1982 and 1984 cycles also showed positive returns, though not as dramatic as 1981.
-
1990s: The 1987 and 1995 cycles were particularly strong, with returns of 11.9% and 27.3% respectively, one year after the rate cuts. The 1998 cycle, however, saw negative returns at three months, six months, and one year, highlighting the variability in market responses.
-
2000s and 2010s: The 2001 and 2007 cycles showed varied performance. The 2001 cycle ended with a negative return of -27.2% one year after the rate cut, indicating a challenging market environment. The 2007 cycle was more positive, with a return of 14.5% one year later. The 2019 cycle showed positive returns at all measured intervals, reinforcing the potential for market growth following rate cuts.
Practical Tips
Investing During Rate Cut Cycles
-
Diversify Your Portfolio: Diversification can help mitigate risks associated with market volatility during rate cut cycles. Consider a mix of stocks, bonds, and other assets to balance potential gains and losses.
-
Monitor Economic Indicators: Keep an eye on key economic indicators such as unemployment rates, GDP growth, and inflation. These metrics can provide insights into the broader economic trends that influence stock market performance.
-
Stay Informed About Federal Reserve Policies: The Federal Reserve's decisions on interest rates can have a profound impact on the stock market. Stay updated on economic policy changes and how they might affect different sectors of the market.
-
Long-Term Perspective: Historically, the S&P 500 has shown positive returns in the long term following rate cuts. While short-term volatility is inevitable, maintaining a long-term investment horizon can help ride out market fluctuations.
Important Takeaways
- The S&P 500 has generally posted positive returns one year after the first interest rate cut.
- Rate cut cycles since 1973 have shown varied performance, with some cycles exhibiting strong growth and others facing significant declines.
- Investors should consider diversification, economic indicators, Federal Reserve policies, and a long-term perspective when navigating rate cut cycles.
Conclusion
The relationship between interest rate cuts and S&P 500 returns is a complex and multifaceted one. While historical data from PinPoint Macro Analytics shows a trend of positive returns following rate cuts, it is essential to recognize the variability and volatility that can occur during these cycles. By staying informed and adopting a strategic approach, investors can better navigate the challenges and opportunities presented by interest rate changes.
Watch the Reel
Questions readers ask
What is the typical performance of the S&P 500 following a rate cut by the Federal Reserve?
Historical data indicates that the S&P 500 often experiences positive average returns within a year of the first rate cut. However, the exact performance can vary across different economic cycles and is influenced by various market factors.
How do interest rate cuts by the Federal Reserve impact the stock market?
Interest rate cuts lower the cost of borrowing, which can stimulate economic activity. This often leads to increased corporate earnings and higher stock prices, making rate cuts a significant event for investors.
Why is it important for investors to consider rate cuts when planning their strategies?
Rate cuts can influence market sentiment and investment strategies. Understanding their impact on the S&P 500 can help investors make informed decisions and prepare for potential market movements.
What are some key factors that affect the S&P 500's performance after a rate cut?
The performance of the S&P 500 after a rate cut can be influenced by a range of factors, including the broader economic context, market sentiment, and the specific conditions of the economic cycle in which the rate cut occurs.
How can investors get a better understanding of the impact of rate cuts on the S&P 500?
Investors can analyze historical data and trends, such as the performance of the S&P 500 following rate cuts from 1973 to the present, to gain insights into potential outcomes and inform their investment strategies.
What should investors expect from the S&P 500 in the year following the first rate cut?
While the S&P 500 tends to show positive average returns in the year following the first rate cut, investors should be prepared for variations based on the specific economic environment and market conditions at the time.
How does the historical performance of the S&P 500 relate to the Federal Reserve's rate cuts in 2023?
The historical performance of the S&P 500 after rate cuts can provide context for understanding potential outcomes in 2023, but it's important to consider the unique factors and economic conditions of the current year, which may differ from past cycles.
Recent articles
Fresh deep dives from the latest Reels we unpacked.




Comments
Be the first to comment.