The Gold-to-Oil Ratio in Historical Context
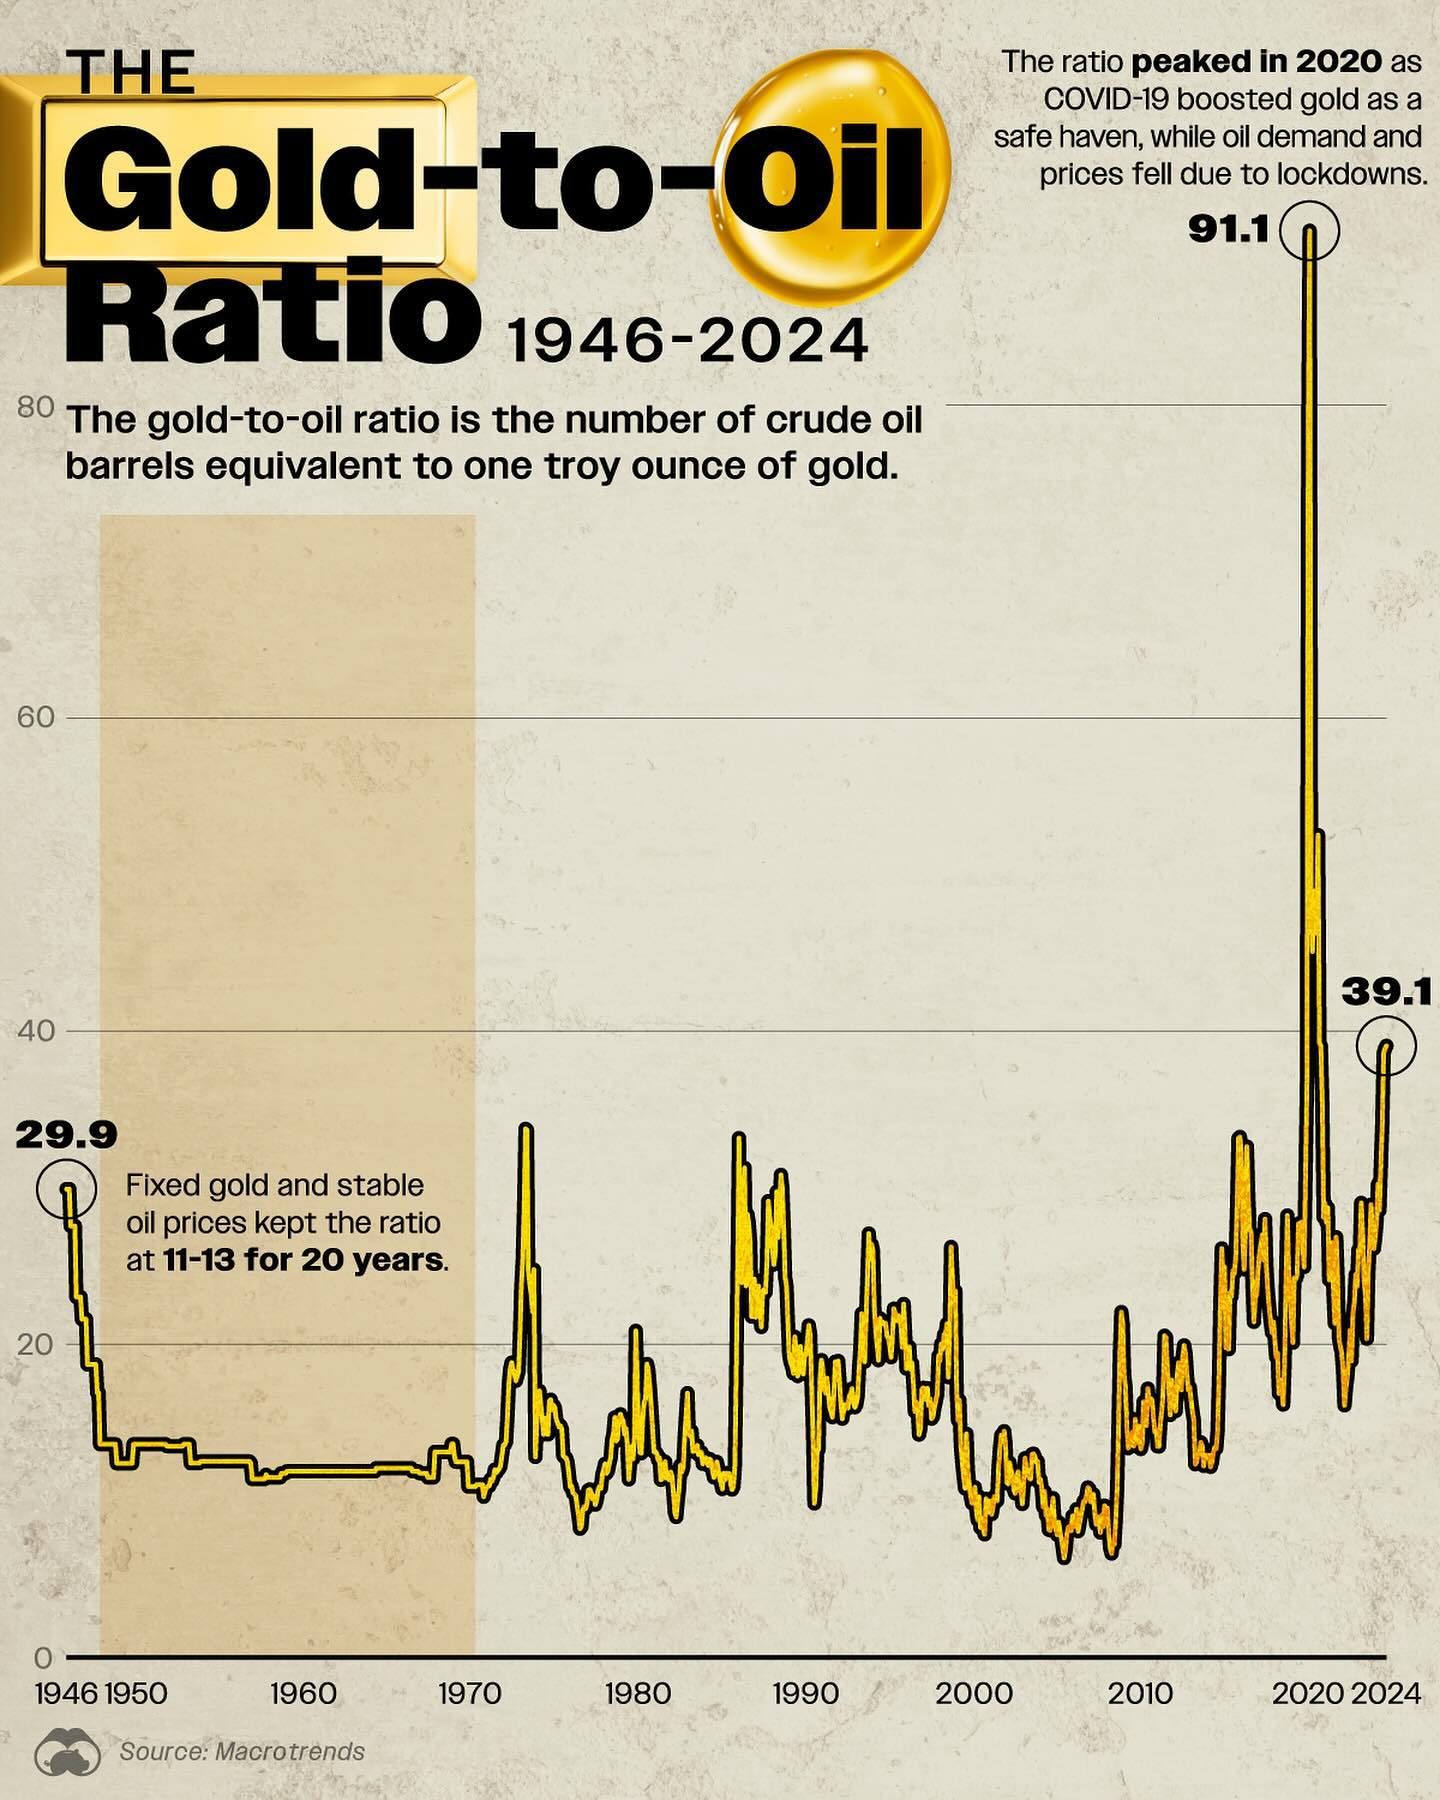
The gold-to-oil ratio is a fascinating metric that provides insights into the relative value of gold and crude oil. Today, the ratio stands at 39.1, making it the second-highest level since 1946, just behind the record 91.1 set in 2020. This ratio indicates that gold is relatively expensive compared to West Texas Intermediate (WTI) crude oil, reflecting shifts in energy demand or monetary uncertainty.
Context / Why this matters
Understanding the gold-to-oil ratio is crucial for investors and analysts who monitor trends in commodities and global markets. Changes in this ratio can signal changes in economic conditions, geopolitical risks, and shifts in investor sentiment. By examining the historical data and fluctuations, one can gain a clearer understanding of these market dynamics and potential future trends.
Main discussion
Historical fluctuations
Over the past 78 years, the gold-to-oil ratio has shown significant volatility, driven by various economic and political events. For instance, the period between 1946 and 2024 saw the ratio fluctuate widely, influenced by factors such as global economic growth, geopolitical tensions, and shifts in energy demand.
Key milestones
The peak of 2020
One of the most notable milestones in the gold-to-oil ratio occurred in 2020. The ratio peaked at 91.1, driven by the COVID-19 pandemic. The widespread lockdowns led to a significant drop in oil demand and prices, while gold soared as investors sought safe-haven assets. This unprecedented event highlighted the ratio's sensitivity to both energy markets and broader economic uncertainties.
A period of stability
From the 1960s to the 1980s, the gold-to-oil ratio remained relatively stable, hovering between 11 and 13. This stability was largely due to fixed gold prices and stable oil prices. The controlled pricing environment during this period helped maintain a consistent ratio, reflecting a more predictable economic landscape.
Influential factors
Geopolitical risks
Geopolitical tensions often drive fluctuations in the gold-to-oil ratio. Conflicts and political instability in oil-producing regions can lead to supply disruptions, causing oil prices to spike. During such periods, gold often receives a boost as investors seek refuge in safer assets. These dynamics create a higher gold-to-oil ratio, reflecting the increased value of gold relative to oil.
Monetary policy
Monetary policy changes, particularly those related to inflation and interest rates, can also impact the gold-to-oil ratio. In times of low interest rates and high inflation, gold tends to perform well as it is seen as a hedge against inflation. Conversely, high interest rates can make borrowing more expensive, potentially dampening demand for oil and other commodities, thereby affecting the ratio.
Practical tips
Monitoring the gold-to-oil ratio
Investors and analysts should closely monitor the gold-to-oil ratio to anticipate potential shifts in the markets. By tracking historical data and current trends, they can make more informed decisions about their investment strategies.
Diversifying portfolios
Given the volatility of the gold-to-oil ratio, diversifying portfolios that include both gold and oil can help mitigate risks. This approach allows investors to balance potential losses in one asset with gains in another, ensuring a more stable investment strategy.
Understanding macroeconomic indicators
Paying attention to macroeconomic indicators, such as inflation rates, interest rates, and geopolitical events, can provide valuable insights into the future direction of the gold-to-oil ratio. Keeping an eye on these factors can help investors prepare for market movements and make timely adjustments to their portfolios.
Important takeaways
The gold-to-oil ratio is a valuable tool for understanding the dynamics between two critical commodities: gold and crude oil. By analyzing historical data and current trends, investors can gain insights into broader economic and geopolitical factors that influence these markets. The ratio's volatility highlights the need for careful monitoring and strategic diversification to navigate the complexities of the global economy.
Conclusion
The gold-to-oil ratio offers a unique perspective on the relative value of gold and oil, influenced by a multitude of economic and geopolitical factors. Whether you're an investor, analyst, or simply someone interested in market trends, understanding this ratio can provide valuable insights into the future direction of these important commodities. By staying informed and adapting to changes, you can make more strategic decisions and better navigate the ever-shifting landscape of global markets.
Watch the Reel
Questions readers ask
What does the current gold-to-oil ratio of 39.1 signify for investors?
The current gold-to-oil ratio of 39.1 indicates that gold is relatively expensive compared to West Texas Intermediate (WTI) crude oil. This ratio can help investors understand shifts in energy demand and monetary uncertainty, providing insights into potential market movements and economic conditions.
How can the gold-to-oil ratio help in assessing geopolitical risks?
The gold-to-oil ratio can serve as a barometer for geopolitical risks. Significant fluctuations in this ratio often correlate with increased geopolitical tensions, as investors may seek safe-haven assets like gold during times of uncertainty, driving up its price relative to oil.
What was the historical significance of the 2020 gold-to-oil ratio peak at 91.1?
The peak gold-to-oil ratio of 91.1 in 2020 was driven by heightened uncertainty and investor fear due to the COVID-19 pandemic. This extreme ratio reflected a significant drop in oil demand and prices, while gold was sought as a safe haven, leading to its high relative value.
How does the gold-to-oil ratio relate to energy demand trends?
The gold-to-oil ratio can provide insights into energy demand trends. A high ratio may indicate lower demand for oil, as seen during economic downturns or shifts towards renewable energy, while a lower ratio might suggest increased industrial activity and higher oil demand.
Why is it useful to compare the gold-to-oil ratio with the SP500?
Comparing the gold-to-oil ratio with the SP500 can offer a broader view of market sentiment. When the gold-to-oil ratio is high and the SP500 is low, it may indicate investor fear and risk aversion. Conversely, a low gold-to-oil ratio paired with a high SP500 could signal investor confidence and optimism in the economy.
What insights can be gained from historical gold-to-oil ratio data?
Examining historical gold-to-oil ratio data reveals macrotrends and cyclical patterns in commodity markets. This information can help investors anticipate future movements, identify long-term trends in energy demand, and better understand how geopolitical events and economic cycles impact gold and oil prices.
How can investors use the gold-to-oil ratio to inform their strategies for 2024?
Investors can use the gold-to-oil ratio to anticipate market trends and adjust their portfolios accordingly. By monitoring this ratio, investors can gauge shifts in investor sentiment, energy demand, and geopolitical risks, allowing them to make informed decisions about allocating assets between gold, oil, and other commodities in 2024.
Recent articles
Fresh deep dives from the latest Reels we unpacked.




Comments
Be the first to comment.