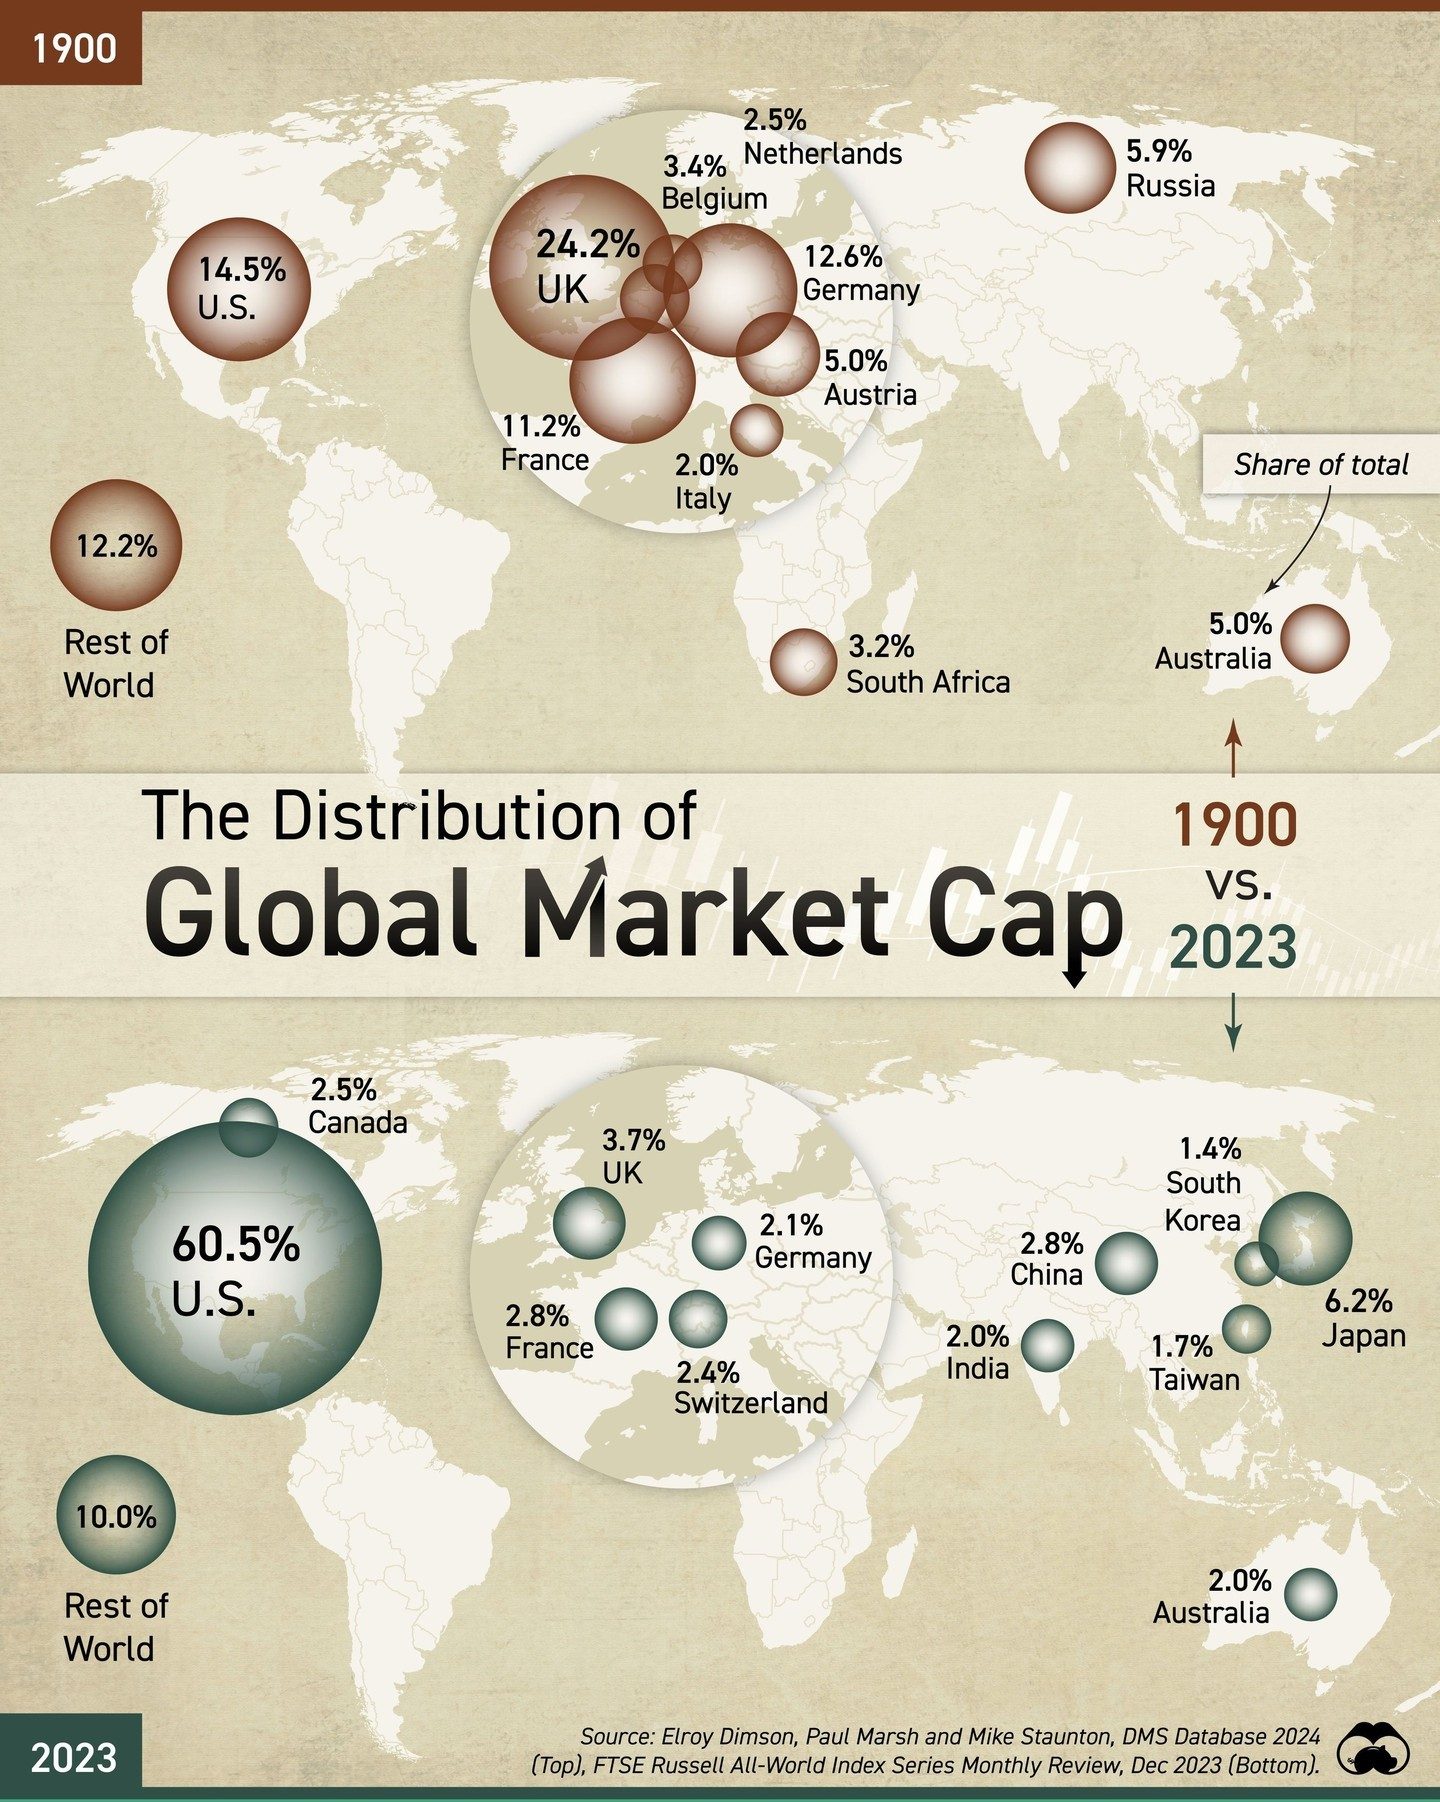
Global Market Cap Distribution: A Century of Shifts
Global market cap distribution has undergone significant changes over the past century. This shift is particularly evident when comparing the distribution in 1900 to that in 2023. Understanding these changes provides valuable insights into the evolving economic landscape and the rise of key financial players.
Why this matters
The distribution of global market capitalization is a critical indicator of economic power and influence. It reflects the strength of national economies and the performance of their stock markets. By examining how this distribution has changed, we can gain a clearer picture of global economic trends and the factors driving these shifts.
Main discussion
The Dominance of European Markets in 1900
In 1900, European countries held a dominant position in global market capitalization, comprising over 67% of the total. The United Kingdom (U.K.) was the leader, with nearly a quarter of the total share. This dominance was a reflection of the U.K.'s industrial and colonial prowess at the time. Other significant contributors included France, Germany, and Italy, each holding substantial shares.
The Rise of the U.S.
A notable shift occurred between 1900 and 2023. The United States' share of global market capitalization increased dramatically, from 14.5% to 60.5%. This rise can be attributed to several factors, including the U.S.'s robust economic growth, innovative industries, and its role as a global financial hub. The New York Stock Exchange (NYSE) has become a cornerstone of the global financial system, attracting investments from around the world.
Changes in European Market Shares
European countries experienced a decline in their market capitalization shares. The U.K.'s share decreased from 24.2% in 1900 to 12.2% in 2023, reflecting the country's economic challenges and the rise of other global markets. Germany's share also decreased, from 5.0% to 2.1%, indicating significant changes in its economic landscape. Other European countries, such as France and Italy, also saw reductions in their market shares, though to a lesser extent.
The Rest of the World
While the U.S. and Europe saw significant shifts, the "Rest of the World" category remained relatively stable, maintaining a 10.0% share in both 1900 and 2023. This stability suggests that while individual countries within this category may have experienced fluctuations, the overall contribution to global market cap remained consistent.
Emerging Markets
Emerging markets, such as China, South Korea, and India, have gained traction in the global market cap distribution. These countries have seen notable increases in their shares, reflecting their rapid economic growth and development. For instance, China's share has increased to 2.5%, and India's to 2.0%, highlighting their growing importance in the global economy.
The Role of Other Countries
Countries like Canada, Australia, and Japan have also played significant roles in the global market cap distribution. Canada's share has remained relatively stable, while Australia and Japan have seen modest increases. Switzerland, known for its stable financial system, has maintained a consistent presence with a 2.8% share in 2023.
Practical tips
Understanding global market cap distribution can be beneficial for investors, policymakers, and economists. Here are some practical tips for leveraging this information:
Diversify Your Portfolio
Given the shifts in market dominance, diversification is key. Investors should consider allocating their portfolios across different regions and sectors to mitigate risks associated with market volatility.
Stay Informed About Economic Trends
Keeping up with economic trends and policy changes in key markets can provide valuable insights. This includes monitoring industrial growth, policy reforms, and regulatory environments in countries with significant market cap shares.
Analyze Market Performance
Regularly analyzing the performance of different stock markets can help identify emerging opportunities. Investors should pay close attention to markets showing strong growth potential, such as those in emerging economies.
Consider Long-Term Investments
Long-term investments in stable markets can offer steady returns. Countries like Switzerland and Japan, known for their stable financial systems, can be good candidates for long-term investment strategies.
Important takeaways
The global market cap distribution has undergone significant changes over the past century. Key takeaways include:
- Shift in Dominance: The U.S. has emerged as the dominant player, increasing its share from 14.5% to 60.5%.
- European Decline: European countries, particularly the U.K. and Germany, have seen their shares decline.
- Emerging Markets: Countries like China, South Korea, and India have gained importance in the global market cap distribution.
- Stability in the Rest of the World: The "Rest of the World" category has remained stable, indicating consistent contributions from various regions.
Conclusion
The distribution of global market capitalization has evolved significantly from 1900 to 2023, reflecting the dynamic nature of the global economy. Understanding these shifts can provide valuable insights for investors, policymakers, and economists. By staying informed about economic trends and market performance, individuals and organizations can make more informed decisions and navigate the ever-changing financial landscape effectively.
Watch the Reel
Questions readers ask
Which regions held the most significant global market cap in 1900?
In 1900, the majority of the global market cap was concentrated in European markets, particularly in countries like the United Kingdom, France, and Germany, which were the leading industrial and economic powers of the time.
What is the current global market share of the United States?
As of 2023, the United States holds nearly 60% of the total global market capitalization, making it the dominant player in the world's financial markets.
How has the global market cap distribution changed in the last 123 years?
Over the past century, there has been a significant shift in global market cap distribution. European markets, which were dominant in 1900, have seen a decline, while the United States has experienced a meteoric rise, now holding the lion's share of the global market.
What does the shift in global market cap distribution signify?
The shift in global market cap distribution signifies a change in economic power and influence. It reflects the performance of national economies and their stock markets, highlighting the rise of the U.S. as a financial superpower and the relative decline of European markets.
Which other regions have seen an increase in market cap over this period?
While the U.S. has seen the most significant increase, other regions such as Asia and the South have also experienced growth in their market cap, contributing to a more diversified global financial landscape.
Why is it important to track changes in global market cap distribution?
Tracking changes in global market cap distribution helps investors and analysts understand global economic trends. It provides insights into where financial opportunities lie and how different economies are performing relative to each other.
What factors have driven the changes in global market cap distribution?
Several factors have driven these changes, including industrialization, technological advancements, geopolitical shifts, and economic policies. The U.S. rise can be attributed to its innovative industries and robust financial regulations, while Europe's decline can be linked to the impact of wars and changes in global trade dynamics.
Recent articles
Fresh deep dives from the latest Reels we unpacked.




Comments
Be the first to comment.