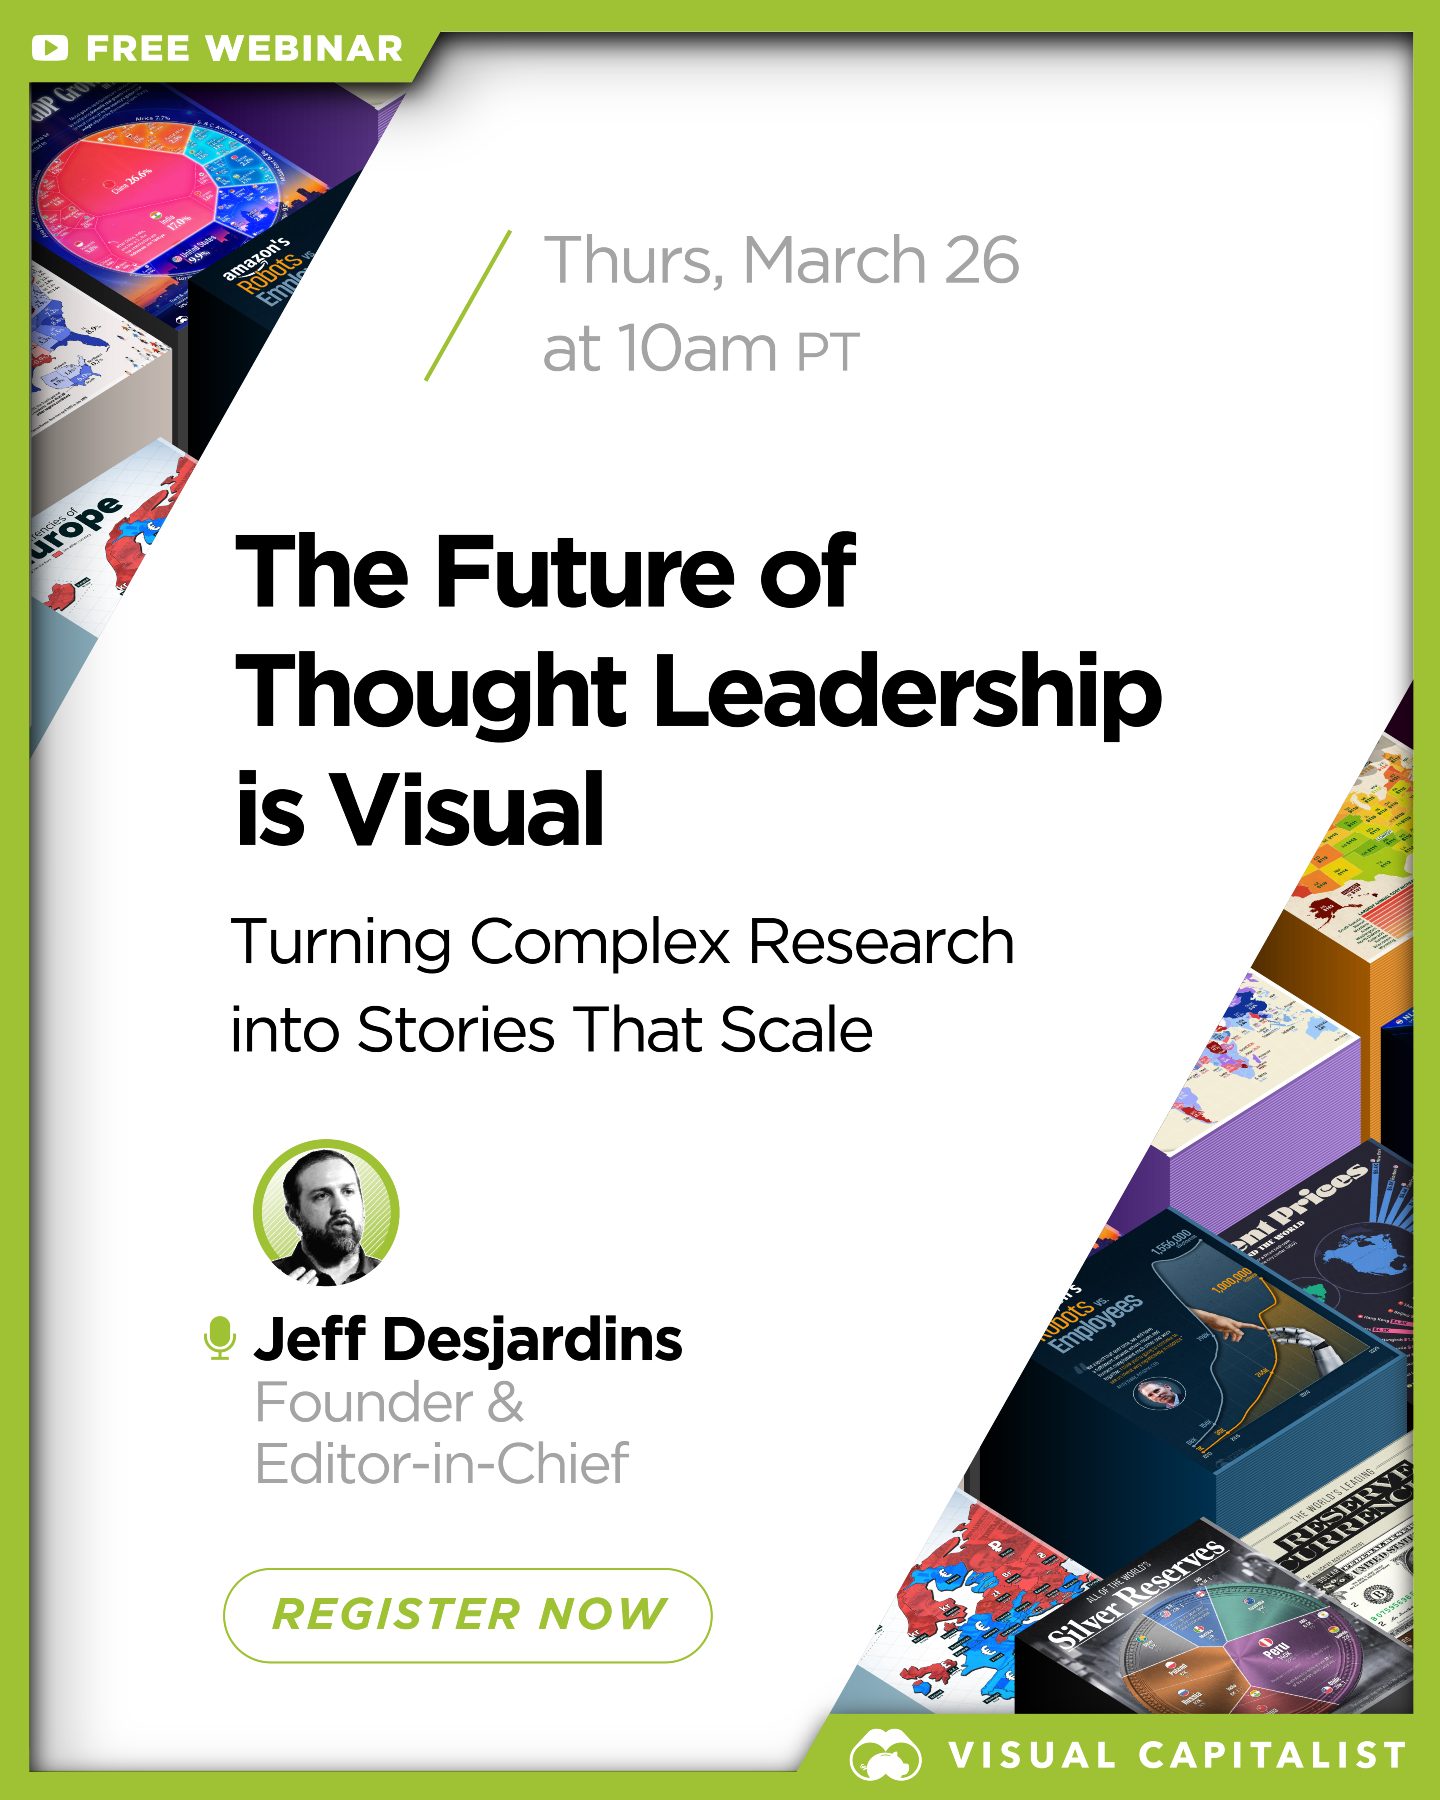
Future of Thought Leadership
Thought leadership is evolving, and visual storytelling is at the forefront of this transformation. Leading organizations are shifting from static reports to dynamic, engaging visual narratives that capture attention and convey complex information effectively. This shift is not just a trend; it's a strategic move to make thought leadership more impactful in the digital age.
Context / Why this matters
In today's information-overloaded world, standing out as a thought leader requires more than just insightful ideas. It demands a compelling way to present those ideas. Visual storytelling turns complex research into stories that resonate with audiences, making the information more accessible and memorable. This approach is crucial for organizations aiming to influence their fields and drive meaningful change.
The transition from traditional reports to visual stories reflects a broader change in how information is consumed. People are more visually oriented than ever, and visual content is processed faster and retained longer than text alone. By embracing visual storytelling, thought leaders can ensure their messages are not just seen but understood and acted upon.
Main discussion
The rise of visual storytelling
Visual storytelling has become a cornerstone of effective communication in the digital era. It’s about more than just aesthetics; it’s about making information comprehensible and engaging. Leading organizations are leveraging visual narratives to transform dry data into compelling stories that drive action and inspire change.
The science behind visuals
Visuals are processed 60,000 times faster than text. This speed is critical in capturing and retaining audience attention. Graphics, charts, and maps don't just make data more digestible; they make it more memorable. By integrating visual elements into thought leadership, organizations can ensure their messages stick with their audience.
Turning complex research into stories that scale
Complex research often gets buried under layers of jargon and dense text. Visual storytelling breaks down these barriers, making intricate data accessible to a broader audience. The key is to turn data points into narrative arcs that tell a story, guiding the audience through the information in a cohesive and understandable manner.
The role of data visualization
Data visualization is a powerful tool in the visual storytelling toolkit. It involves translating numerical data into graphical formats like charts, graphs, and infographics. These visuals help audiences grasp complex information quickly and intuitively. Whether it’s a bar chart illustrating market trends or a heat map showing geographic data, visuals make data more approachable and meaningful.
Case studies and examples
Leading organizations have already begun to reap the benefits of visual storytelling. For example, VISUAL CAPITALIST is renowned for its ability to transform complex data into visually engaging narratives. Their approach not only makes information more accessible but also more engaging, driving higher levels of audience interaction and sharing.
The impact of visuals on engagement
Visual storytelling doesn’t just make information more understandable; it also enhances engagement. People are more likely to share and discuss content that is visually appealing. This increased engagement can lead to broader reach and greater influence, amplifying the impact of thought leadership efforts.
Engagement metrics
Metrics like views, shares, and comments are higher for visual content. For instance, posts with images produce 650% higher engagement than text-only posts. This statistic underscores the power of visuals in capturing and holding audience attention, making them indispensable for thought leaders aiming to make a significant impact.
Practical tips
To effectively leverage visual storytelling in thought leadership, consider the following tips:
Start with a clear narrative
Begin by identifying the core message or story you want to convey. Use this narrative to guide the creation of your visuals. Every visual element should support and enhance the overall story, ensuring that the message is clear and cohesive.
Use diverse visual elements
Incorporate a variety of visual elements, including charts, graphs, infographics, and even interactive maps. Each type of visual can serve a different purpose, from illustrating trends to showing relationships between data points.
Keep it simple and focused
While visuals can be complex, the design should be clean and uncluttered. Avoid overwhelming the audience with too much information at once. Break down the content into digestible parts, using visuals to guide the audience through each section.
Use high-quality visuals
The quality of your visuals reflects on your brand. Invest in high-quality images, graphics, and design tools. Ensure that your visuals are not just aesthetically pleasing but also professional and polished.
Integrate visuals into your content strategy
Visual storytelling should be an integral part of your overall content strategy. Plan your visual content in advance, aligning it with your broader marketing and communication goals. This ensures that your visuals are consistent, relevant, and impactful.
Important takeaways
Thought leadership is evolving, and visual storytelling is leading the way. By turning static reports into engaging visual narratives, leading organizations are making their insights more accessible, memorable, and impactful. The future of thought leadership is visual, and those who embrace this shift will be better positioned to influence and inspire their audiences.
Conclusion
The future of thought leadership lies in the power of visual storytelling. By leveraging visuals to turn complex research into engaging narratives, organizations can make their insights more accessible and impactful. This shift is not just a trend; it's a strategic necessity in today's visually-driven world. Embrace visual storytelling to elevate your thought leadership and drive meaningful change in your field.
Watch the Reel
Questions readers ask
What makes visual storytelling effective in thought leadership?
Visual storytelling is effective in thought leadership because it simplifies complex ideas, making them more accessible and engaging. Visuals are processed faster by the brain than text, ensuring that information is not only seen but truly understood and retained longer.
How can organizations adapt to the shift towards visual storytelling in thought leadership?
Organizations can adapt by transitioning from static reports to dynamic, engaging visual narratives. This involves incorporating more infographics, videos, and interactive content into their thought leadership strategies to capture and retain audience attention effectively.
What are the benefits of using visuals in thought leadership content?
Using visuals in thought leadership content enhances memory retention, making the information more memorable. Visuals also help to convey complex data and insights more clearly, ensuring that the audience grasps the key points quickly and easily.
Why is visual storytelling important for standing out in a crowded digital landscape?
In a world saturated with information, visual storytelling helps organizations stand out by presenting information in a more engaging and memorable way. It ensures that the content not only reaches the audience but also makes a lasting impact, differentiating the organization from competitors.
What trends in visual storytelling should thought leaders be aware of for 2024?
Thought leaders should be aware of trends such as the integration of interactive elements, the use of data visualization to make complex information more accessible, and the growing importance of visual content across various platforms, including webinars and social media.
Related deep dives
Similar reads based on topic and creator.

Recent articles
Fresh deep dives from the latest Reels we unpacked.




Comments
Be the first to comment.