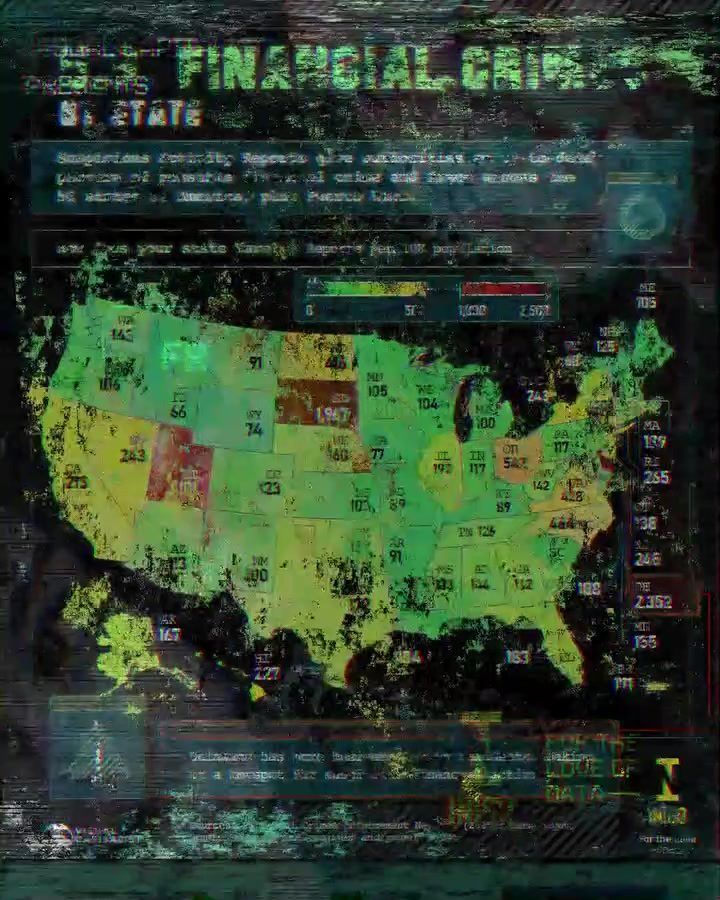
Financial crime is an evolving challenge, with fraudsters employing increasingly sophisticated tactics to exploit vulnerabilities in the financial system. From social engineering scams to corporate embezzlement and crypto hacks, the landscape of financial crime is both vast and complex. The recent data visualization of suspicious financial crime reports across U.S. states offers a nuanced look at where and how these activities are occurring. By analyzing the data, key insights and actionable information can be gleaned, helping individuals and organizations better understand and mitigate the risks of financial crime.
Context / Why this matters
The evolving landscape of financial crime
The scale and sophistication of financial crime are accelerating, driven in part by advancements in technology. Criminals are leveraging artificial intelligence and other tools to perpetrate scams, making it increasingly difficult for authorities to stay ahead. Understanding the trends and patterns in financial crime is crucial for both individuals and organizations to protect themselves from these emerging threats. This data visualization not only highlights the geographical distribution of suspicious financial activity but also underscores the need for heightened vigilance and proactive measures.
The importance of data visualization
Data visualization plays a pivotal role in understanding complex issues like financial crime. By converting raw data into visual formats, such as maps and charts, it becomes easier to identify patterns, trends, and hotspots. This method of presenting information allows for a more accessible and actionable understanding of the data. For instance, the visualization of suspicious activity reports across U.S. states provides a clear view of which areas are most affected, enabling targeted interventions and preventive measures.
Main discussion
Understanding the data
The data visualization focuses on Suspicious Activity Reports (SARs), which are critical tools for authorities in tracking potential financial crime and fraud. These reports offer an up-to-date picture of possible financial crimes across all 50 states and Puerto Rico. By examining the data, it is possible to see how different regions fare in terms of the number of reported incidents per 10,000 population. This metric provides a standardized way to compare the frequency of suspicious activities across diverse regions with varying population densities.
Key findings
- Delaware as a hotspot: One of the standout insights from the data is that Delaware has a particularly high rate of suspicious financial activity. This is partly due to the state's unique business environment, where the number of businesses exceeds the number of residents. This makes Delaware a prime target for various financial crimes, including corporate embezzlement and other fraudulent activities.
- Regional variations: The visualization reveals significant variations in the number of SARs across different states. States like North Dakota, Iowa, and Kentucky have lower rates of reported suspicious activity, while others like New Jersey, Massachusetts, and the District of Columbia show higher rates. These variations highlight the need for tailored strategies to address financial crime in different regions.
Sources and methodology
The data used in this visualization is sourced from the Financial Crimes Enforcement Network (FinCEN) for the year 2024. Additionally, population figures from the U.S. Census Bureau are used to normalize the data, allowing for a more accurate comparison across different states. It is important to note that the figures are rounded and may not reflect the exact number of incidents, but they still provide a reliable indication of the trends and patterns in financial crime.
Turning insights into action
The visualization not only presents the data but also emphasizes the importance of turning these insights into actionable steps. This involves several key strategies:
- Enhanced surveillance: With a clearer understanding of where financial crimes are most prevalent, authorities can enhance surveillance and monitoring in high-risk areas. This includes increasing the frequency of audits and inspections in regions with higher rates of suspicious activity.
- Proactive measures: Organizations can use this data to implement proactive measures such as advanced fraud detection systems, employee training programs, and stricter internal controls. These steps can help prevent potential fraudulent activities before they occur.
- Collaboration and partnerships: Collaboration between financial institutions, law enforcement agencies, and regulatory bodies is crucial in the fight against financial crime. Sharing data and insights can lead to more effective and coordinated efforts to combat fraud.
The role of INIGO
INIGO, a prominent name in the realm of data security and fraud prevention, is at the forefront of turning data insights into actionable strategies. Their partnership with Visual Capitalist in this editorial series underscores the importance of leveraging data to mitigate financial crime risks. INIGO's expertise in data analysis and cybersecurity can provide valuable guidance to organizations looking to protect themselves from evolving threats.
Practical tips
For Individuals
- Stay informed: Keeping up with the latest trends and techniques used by fraudsters can help individuals recognize and avoid potential scams. Regularly updating knowledge about common financial crimes and being cautious with personal information can significantly enhance personal security.
- Secure your accounts: Using strong, unique passwords and enabling two-factor authentication can add an extra layer of security to personal and financial accounts. Additionally, monitoring bank statements and credit reports regularly can help detect any unauthorized activities early.
For Organizations
- Implement robust fraud detection systems: Advanced technologies like artificial intelligence and machine learning can help detect unusual patterns and anomalies that may indicate fraudulent activities. Ensuring that these systems are regularly updated and trained on the latest data can enhance their effectiveness.
- Conduct regular audits: Regular internal and external audits can help identify vulnerabilities and weaknesses in the organization's financial controls. These audits should be conducted by independent parties to ensure unbiased assessments.
- Train employees: Employees are often the first line of defense against financial crimes. Providing regular training on identifying and reporting suspicious activities can significantly reduce the risk of fraud within the organization.
Important takeaways
- Data visualization is a powerful tool: By transforming raw data into visual formats, it becomes easier to identify patterns, trends, and hotspots in financial crime. This makes data visualization an invaluable tool for understanding and combating financial crime.
- Understanding regional variations is crucial: The geographical distribution of financial crimes varies significantly across different regions. This highlights the need for tailored strategies and interventions to address these variations effectively.
- Proactive measures are essential: Enhancing surveillance, implementing advanced fraud detection systems, and conducting regular audits are crucial steps in mitigating the risks of financial crime.
Conclusion
Financial crime is a complex and evolving challenge that requires a multi-faceted approach to address effectively. By leveraging data visualization and insights from organizations like INIGO, individuals and organizations can better understand and mitigate the risks associated with financial crime. Whether through enhanced surveillance, proactive measures, or collaborative efforts, the fight against financial crime demands a collective and informed response.
Watch the Reel
Questions readers ask
Which states are currently considered the most significant financial crime hotspots in the U.S.?
The data visualization highlights that states like California, Florida, and Texas are among the most significant hotspots for financial crime. These states report a high number of suspicious activity reports, indicating elevated levels of financial fraud and other illicit activities.
How can individuals protect themselves from financial fraud in these hotspot states?
Individuals can take several steps to protect themselves, such as being cautious of unsolicited requests for personal or financial information, monitoring their financial accounts regularly, and using strong, unique passwords for online accounts. Additionally, staying informed about common scams in their area can enhance personal security.
What types of financial crimes are most commonly reported in these hotspot states?
The most commonly reported financial crimes include identity theft, credit card fraud, and investment scams. These crimes often exploit vulnerabilities in digital platforms and take advantage of individuals' lack of awareness about sophisticated scams.
Why does Delaware have a disproportionately high number of suspicious financial crime reports compared to other states?
Delaware's status as a corporate haven, with many businesses and financial entities registered there, contributes to its high number of suspicious activity reports. The state's business-friendly laws and large corporate presence make it a target for various forms of financial fraud, including corporate embezzlement and money laundering.
How can organizations use state-by-state financial crime data to enhance their security measures?
Organizations can use this data to identify high-risk areas and tailor their security protocols accordingly. By understanding the specific types of financial crimes prevalent in certain states, businesses can implement targeted training programs, enhance monitoring systems, and develop more robust risk management strategies.
What are the most effective ways to report and mitigate financial fraud?
Reporting financial fraud to local law enforcement, the Federal Trade Commission (FTC), or the Internet Crime Complaint Center (IC3) can help mitigate its impact. Additionally, organizations should establish internal reporting mechanisms and foster a culture of vigilance to quickly identify and address potential fraudulent activities.
How does the data visualization help in understanding financial crime trends in the U.S.?
The data visualization provides a visual representation of financial crime trends across different states, making it easier to identify patterns and hotspots. This visualization can help stakeholders, including law enforcement, financial institutions, and individuals, better understand the geographic distribution of financial crimes and allocate resources more effectively.
Recent articles
Fresh deep dives from the latest Reels we unpacked.




Comments
Be the first to comment.