Global Economic Data Visualization
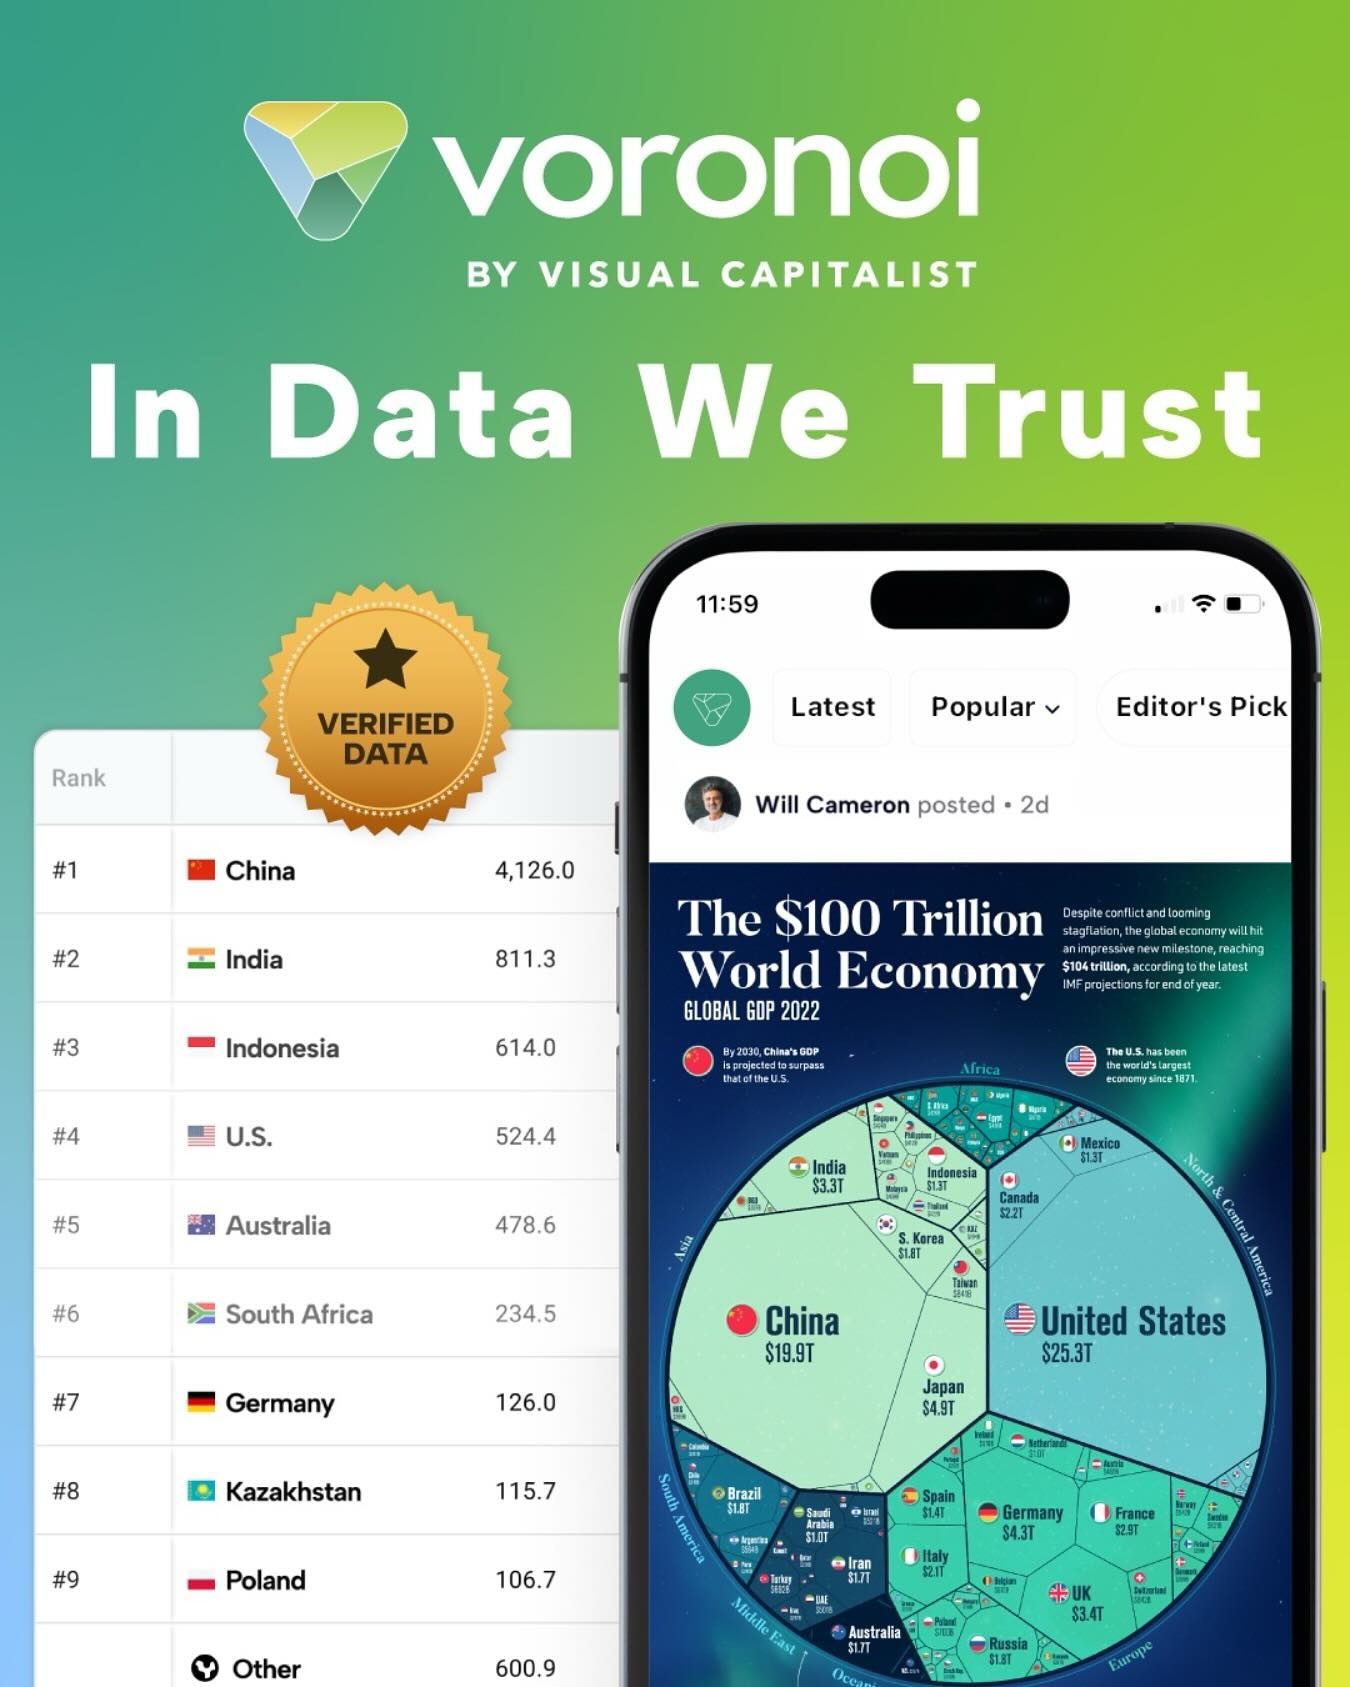
Understanding the global economy can be complex, but data visualization tools like Voronoi simplify this by presenting verified economic data in an accessible format. This visualization focuses on the top countries by GDP, providing a clear picture of the economic landscape and offering insights into the future of global finance.
Context / Why this matters
The global economy is a dynamic and interconnected system, influenced by a myriad of factors including trade, conflict, and economic policies. Keeping track of these changes is essential for businesses, governments, and individuals alike. Accurate and reliable data visualization tools like Voronoi become indispensable for interpreting these complex dynamics.
Main discussion
Analyzing the Top Countries by GDP
The visualization highlights the top countries by GDP, providing a snapshot of the global economic powerhouses. The pie chart and map display the contributions of each country, making it easy to understand how these economies stack up against each other. The data includes projections and highlights key points that are pivotal for understanding the current economic landscape.
United States and China
The United States and China are the two largest economies in the world, with the U.S. currently holding the top spot. China's GDP is projected to surpass the U.S. in the near future, reflecting China's rapid economic growth and industrial development. This shift is a significant milestone in the global economy and underscores the rising influence of emerging markets.
India, Australia, and Other Key Players
India, with its vast population and growing middle class, is another economic powerhouse. Its GDP is projected to continue growing, driven by technological advancements and increased participation in global trade. Australia, a major player in the Asia-Pacific region, benefits from its rich natural resources and strong trade relationships.
Germany and Poland, representing Europe, are also crucial players. Germany's robust industrial sector and technological innovation make it a leader in Europe, while Poland's growing economy and strategic investments contribute significantly to the region's overall economic health.
Impact of Conflicts and Economic Projections
Despite ongoing conflicts and looming economic challenges, the global economy is projected to hit $104 trillion by the end of the year, according to the latest IMF projections. This resilience reflects the global economy's ability to adapt and grow despite adversity. However, it also highlights the need for vigilance and strategic planning to navigate potential recessions and geopolitical tensions.
The Role of Data Visualization
Data visualization is essential for making sense of complex economic data. By presenting information in visual formats like pie charts and maps, tools like Voronoi help users understand the intricacies of global economic trends and projections. Visualizations make data accessible and actionable, allowing stakeholders to make informed decisions and stay ahead of economic changes.
Practical tips
Leveraging Data for Business Strategies
For businesses, understanding global economic trends can inform strategic decisions. Here are some practical tips for leveraging data visualization tools like Voronoi:
-
Identify Growth Opportunities: Use visualizations to identify emerging markets and growth opportunities. For instance, the rapid economic growth in India and China indicates significant potential for investment and expansion.
-
Risk Assessment: Assess economic risks by analyzing visual data. For example, understanding the economic impact of conflicts and recessions can help businesses prepare contingency plans.
-
Market Analysis: Conduct market research by analyzing economic contributions from different countries. This can help businesses tailor their products and services to meet specific market demands.
-
Stay Updated: Keep abreast of the latest economic projections and trends. Voronoi’s visualizations are frequently updated with the latest data, ensuring you have the most current information at your fingertips.
Utilizing Verified Data
Trusting verified data sources is crucial for making informed decisions. Tools like Voronoi ensure that the data presented is reliable and accurate, backed by verified sources. This reliability helps build confidence in the insights gained from visualizations.
Important takeaways
Understand the Role of Data Visualization: Data visualization transforms complex economic data into easily understandable formats, making it accessible to a broader audience.
Stay Updated: Economic data is constantly evolving. Regularly reviewing updated visualizations helps stay informed about the latest trends and projections.
Global Economic Resilience
The global economy demonstrates resilience despite various challenges. This resilience is a testament to the adaptability and growth potential of the global economic system.
Potential for Growth
Emerging markets, particularly in Asia, offer significant growth opportunities. Countries like India and China are poised for economic expansion, making them attractive for investment and business development.
Conclusion
The global economic landscape is a complex web of interconnected factors that influence the financial health and stability of nations. By leveraging data visualization tools like Voronoi, stakeholders gain valuable insights into these dynamics, enabling them to make informed decisions and strategies. Understanding the top countries by GDP, the impact of conflicts, and economic projections can help businesses, governments, and individuals navigate the global economy effectively. Embracing reliable, data-driven insights through visualization tools ensures that we are equipped to thrive in an ever-changing economic environment.
Watch the Reel
Questions readers ask
Which countries have the largest economies by GDP?
The United States and China currently have the largest economies by GDP. This means they have the highest total economic output among all countries globally, making them key players in the world economy.
Why is visualization important when analyzing the world economy?
Visualization simplifies complex data, making it easier to understand and interpret. Tools like Voronoi present verified economic data in a clear format, helping users to grasp global economic trends and compare the economic performance of different countries.
How does the world economy by GDP help in understanding global finance?
Examining the world economy by GDP provides insights into which countries contribute the most to the global financial landscape, helping in identifying economic trends, and making informed decisions about investments, trade, and policy.
How do the economies of the United States and China compare to the rest of the world?
The U.S. and China lead the global economy in GDP. Their economic activities, policies, and growth rates significantly impact the global financial landscape, making them crucial to watch for businesses and governments worldwide.
What factors influence the global economic landscape?
The global economy is influenced by various factors, including trade agreements, geopolitical conflicts, and domestic economic policies. Keeping track of these changes helps in understanding shifts in the economic strength of different countries.
How can reliable data visualization tools assist in understanding economic data?
Reliable data visualization tools, like Voronoi, present verified economic data in an accessible and comprehensible format. This helps users to gain insights into the economic performance of countries, spot trends, and make data-driven decisions.
What are the benefits of using visualizations for the latest economic data?
Using visualizations for the latest economic data allows for a quick and clear understanding of the current economic landscape. This can help in anticipating future trends and making well-informed economic decisions.
Recent articles
Fresh deep dives from the latest Reels we unpacked.




Comments
Be the first to comment.