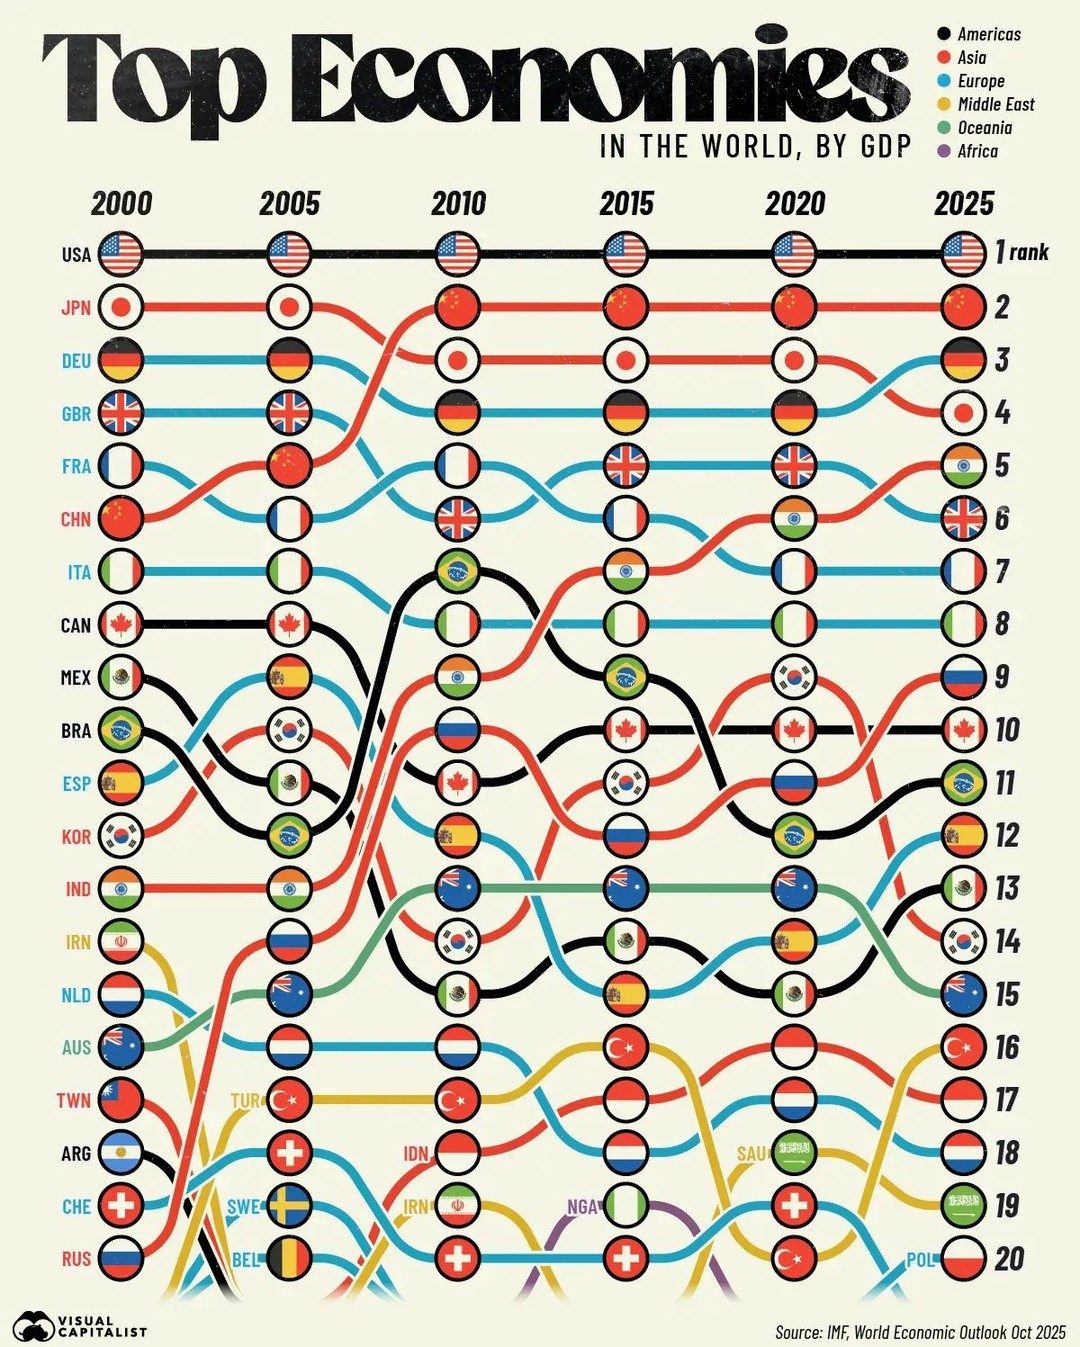
The World's Largest Economies: A Dynamic Shift from 2000 to 2025
The global economic landscape has seen significant shifts over the past few decades. The United States has maintained its position as the world’s largest economy, while China has experienced a remarkable rise, becoming the second-largest economy by 2010. By examining the top economies from 2000 to 2025, we can gain insights into the dynamic changes in global economic power.
Why This Matters
Tracking the growth and changes in the world's largest economies is crucial for understanding global economic trends. These trends influence international trade, investment strategies, and geopolitical dynamics. Knowing which economies are on the rise and which are faltering can help businesses, governments, and individuals make informed decisions about where to invest, where to focus research and development, and where to allocate resources.
The Evolution of Global Economic Power
The Dominance of the United States
The United States has remained the world’s largest economy since 2000. The country's GDP has grown from $10.3 trillion to an impressive $30.6 trillion by 2025. This sustained growth underscores the U.S. economy's resilience and adaptability in the face of global challenges. The U.S. economy is driven by a diverse range of industries, including technology, finance, healthcare, and manufacturing, which have contributed to its robust performance.
The Rise of China
China's economic journey is one of the most dramatic in history. From being a relatively small player in 2000, China has expanded its GDP by nearly 17 times. This meteoric rise positioned China as the world’s second-largest economy by 2010. The country's economic transformation is a result of aggressive industrialization, rapid urbanization, and significant investments in infrastructure. China's rise has not only lifted hundreds of millions out of poverty but has also made it a major player in global trade and manufacturing.
Europe's Steady Contribution
European economies, such as those of Germany (DEU), the United Kingdom (GBR), and France (FRA), have maintained their positions among the top economies. These countries are known for their robust industrial sectors, advanced technologies, and strong financial systems. While their growth rates may not be as dramatic as China's, their stability and continued contribution to the global economy are notable.
Emerging Economies
Emerging economies like India (IND), Brazil (BRA), and South Korea (KOR) have also made significant strides. India, in particular, has shown remarkable growth potential, driven by its large and young workforce, growing middle class, and increasing integration into the global economy. Brazil, despite facing economic challenges, remains a key player in Latin America, while South Korea continues to be a leader in technology and innovation.
The Methodology: IMF Data and Visual Capitalist's Infographic
The data driving these insights comes from the International Monetary Fund (IMF) and is visualized by Visual Capitalist. The line graph presented covers the period from 2000 to 2025 and provides a clear visual representation of how different countries' rankings have changed over time. This visualization helps in understanding the complex dynamics of global economic power shifts, making it easier to identify trends and patterns.
Key Insights from the Infographic
- Dramatic Shifts in Ranking: The infographic highlights how countries have moved up or down the economic ladder. For instance, China's rapid ascent from a lower ranking to the second position is starkly evident.
- Growth Trajectories: The line graph shows the GDP growth trajectories of different countries, providing a clear picture of which economies have expanded the most and which have struggled.
- Stability and Volatility: The visualization also reveals the stability of certain economies, such as the United States and Germany, versus the volatility of others, like Russia, which has experienced significant fluctuations due to geopolitical and economic factors.
Practical Tips for Understanding Global Economic Trends
Follow Key Economic Indicators
To stay updated on global economic trends, it's essential to track key indicators such as GDP growth, inflation rates, and unemployment figures. These indicators provide a comprehensive view of a country's economic health and help in predicting future trends.
Utilize Reliable Data Sources
Relying on credible data sources, such as the IMF, World Bank, and national statistical agencies, is crucial for accurate analysis. These organizations provide detailed and reliable data that can be used to make informed decisions.
Use Visualization Tools
Visualization tools, like the infographic by Visual Capitalist, make it easier to understand complex data. They help in identifying patterns, trends, and outliers, making it simpler to comprehend the dynamics of global economic power shifts.
Important Takeaways
- Sustained Growth: The U.S. economy has shown sustained growth over the past two decades, maintaining its position as the world's largest economy.
- Rapid Ascent: China's rapid economic growth has positioned it as the second-largest economy, highlighting the potential for dramatic shifts in global economic power.
- European Stability: European economies have maintained their positions among the top economies, providing stability to the global economic landscape.
- Emerging Economies: Countries like India and South Korea have shown significant growth potential, contributing to the diversification of global economic power.
Conclusion
The global economic landscape is dynamic and ever-changing. From the sustained dominance of the United States to the rapid rise of China and the steady contribution of European economies, each country's economic journey tells a unique story. By tracking these trends and utilizing reliable data sources, we can better understand the complex dynamics of global economic power and make informed decisions. The visualizations provided by Visual Capitalist, based on IMF data, offer a clear and insightful look into these shifts, helping us navigate the intricate web of global economic trends.
Watch the Reel
Questions readers ask
Which countries had the most significant economic shifts from 2000 to 2025?
The most notable shifts occurred in the United States and China. The U.S. maintained its lead as the world's largest economy, while China's rapid growth saw it become the second-largest economy by 2010 and continue to expand significantly by 2025.
What factors contributed to China's economic growth from 2000 to 2025?
China's economic growth can be attributed to several factors, including industrialization, increased foreign investment, and a large, low-cost labor force. Additionally, strategic government policies and a focus on manufacturing and exports played a pivotal role.
How did the economic shifts from 2000 to 2025 influence international trade?
The rise of China as a major economic powerhouse led to a significant increase in global trade volumes. Many countries shifted their manufacturing bases to China, altering supply chains and trade routes. The U.S. also saw changes in its trade dynamics, with increased focus on technology and services.
What was the GDP of the largest economies in 2025?
By 2025, the GDP of the largest economies saw significant changes. The U.S. remained at the top, with a projected GDP of over $25 trillion. China followed closely, with a GDP of around $20 trillion, reflecting its remarkable growth trajectory from 2010 onward.
How did the economic changes from 2000 to 2025 affect geopolitical dynamics?
The economic shifts altered geopolitical dynamics by changing the balance of power. China's rise led to increased influence in global affairs, while the U.S. had to adapt its foreign policies to accommodate this new economic reality. This period also saw the emergence of new economic alliances and trade agreements.
Which sectors drove the economic growth in the top economies from 2000 to 2025?
In the U.S., sectors like technology, healthcare, and financial services were major drivers of economic growth. In China, manufacturing, infrastructure development, and technology played significant roles. Other emerging economies saw growth in areas like renewable energy, digital services, and agricultural exports.
How did the rise of China impact other emerging economies from 2000 to 2025?
China's rise had a mixed impact on other emerging economies. Some benefited from increased trade and investment opportunities, while others faced stiff competition. Countries that could integrate into China’s supply chains often saw economic benefits, but those relying on similar manufacturing sectors faced challenges.
Related deep dives
Similar reads based on topic and creator.


Recent articles
Fresh deep dives from the latest Reels we unpacked.




Comments
Be the first to comment.