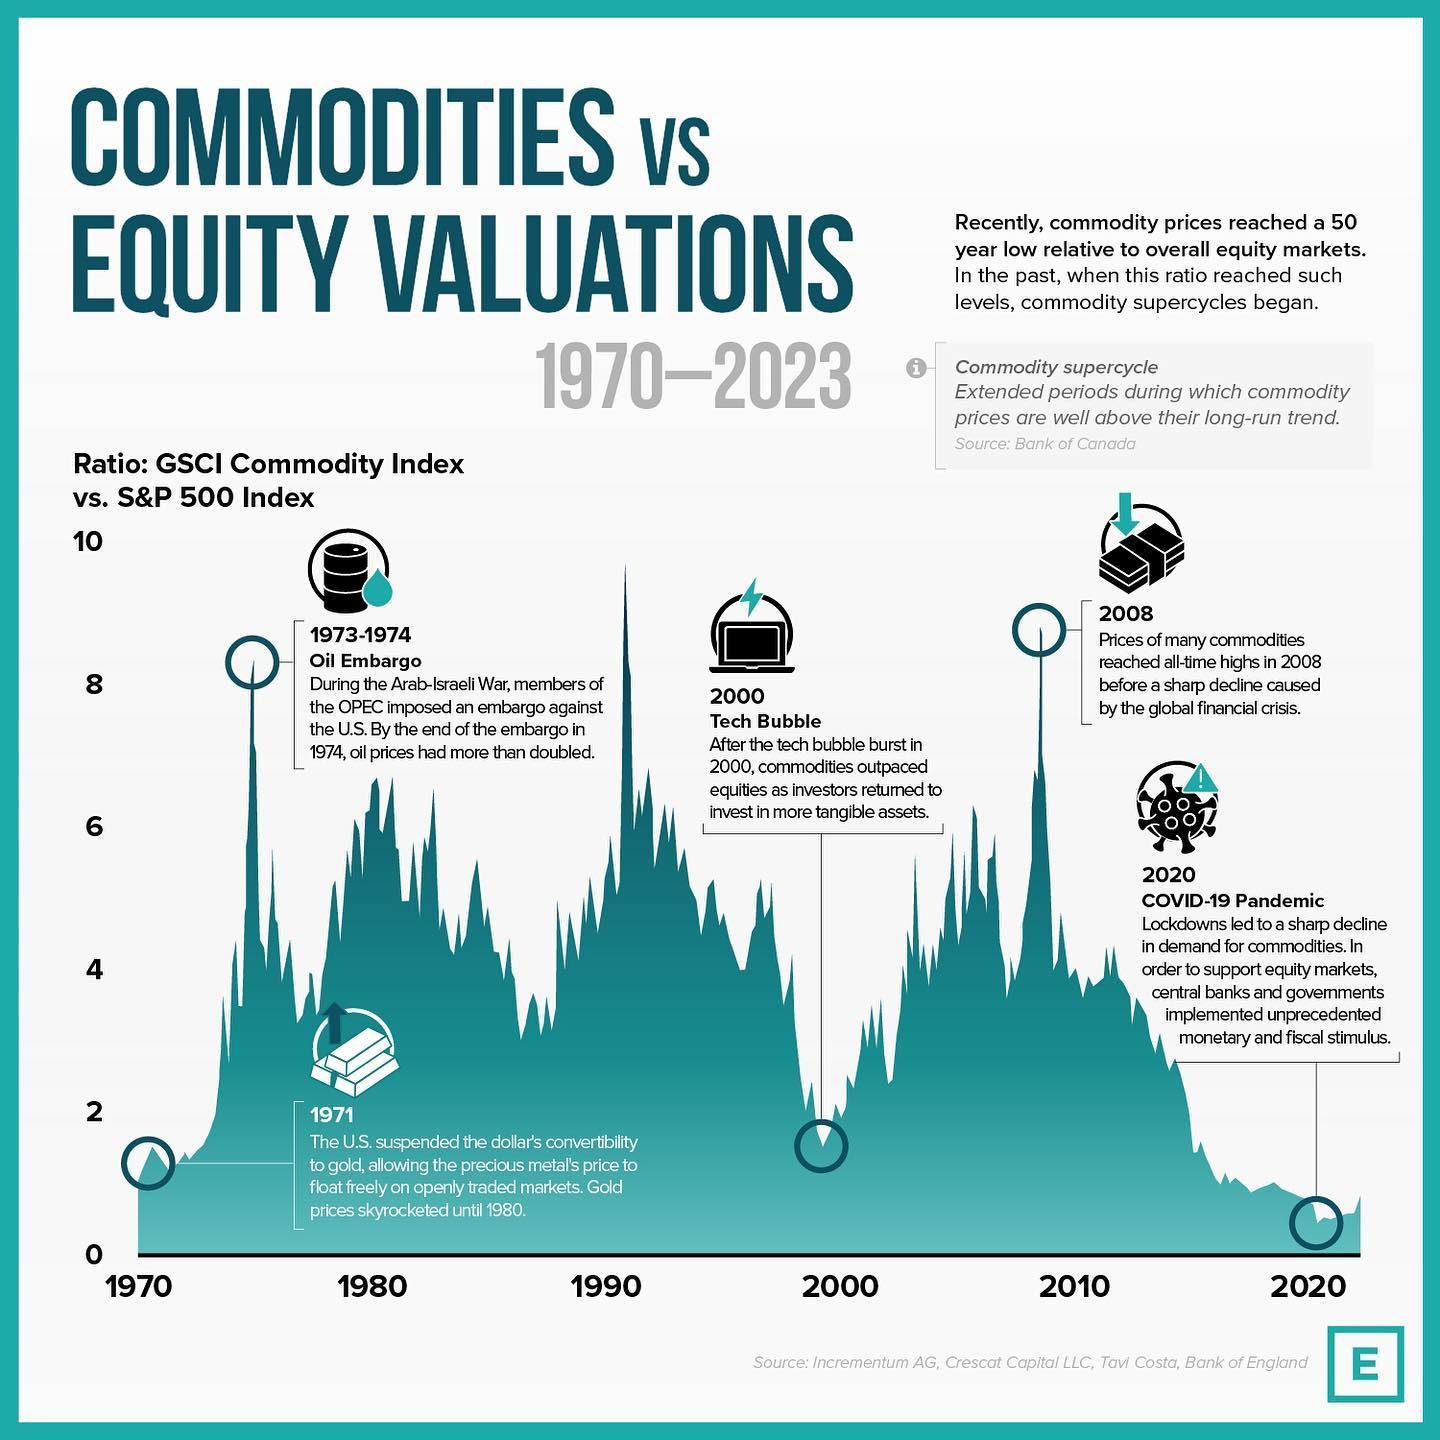
Commodity vs. Equity Valuations
Investors have witnessed a significant shift in the relationship between commodity prices and equity valuations. Over the past few decades, and notably in recent years, commodity prices have reached a 50-year low relative to overall equity markets, specifically the S&P 500. This dynamic has historical significance, as similar lows in the ratio of commodities to equities have often signaled the start of new commodity supercycles. Understanding this relationship can provide valuable insights into market trends and investment strategies.
Context / Why This Matters
The valuation of commodities relative to equities is a critical measure for investors. Commodities, such as gold, oil, and agricultural products, are tangible assets that often serve as hedges against inflation and market volatility. Equities, on the other hand, represent ownership in companies and are subject to market sentiment, economic cycles, and corporate performance. The ratio of the GSCI Commodity Index to the S&P 500 Index offers a clear picture of how these two asset classes are valued relative to each other.
Main Discussion
Historical Context
To grasp the current state of commodity vs. equity valuations, it's essential to look at key historical events and their impacts. The graph from 1970 to 2023 highlights several pivotal moments:
-
1973-1974 Oil Embargo: This event led to a significant doubling of commodity prices. The embargo, triggered by the Arab-Israeli War, caused a sharp increase in oil prices, which in turn boosted the value of other commodities. This period marked a significant shift in global energy markets and had a lasting impact on commodity valuations.
-
1971 Dollar-Suspension: In 1971, the U.S. suspended the dollar's convertibility to gold, allowing the precious metals price to float freely on openly traded markets. This move led to a surge in gold prices, which continued until 1980. The decoupling of the dollar from gold had profound effects on commodity markets, as investors sought safe-haven assets in the face of economic uncertainty.
-
2000: Around the year 2000, commodities outperformed equities as investors returns to tangible assets. This shift was driven by various factors, including the dot-com bubble burst and growing concerns about the stability of financial markets. Commodities were seen as a more reliable store of value during this period.
-
2008 Financial Crisis: In 2008, many commodities reached all-time highs before a sharp decline caused by the global financial crisis. The crisis led to a significant drop in demand for commodities, as economic activity slowed and investors fled to safer assets. The ratio of commodities to equities plummeted during this period, reflecting the severe economic downturn.
-
2020 COVID-19 Pandemic: The COVID-19 pandemic caused a sharp decline in demand for commodities, prompting unprecedented monetary and fiscal stimulus. The pandemic led to a global economic shutdown, which temporarily disrupted supply chains and reduced demand for commodities. However, the subsequent stimulus measures helped to stabilize and eventually boost commodity prices.
Practical Tips
Monitoring Key Indicators
Investors should keep a close eye on key indicators to understand the relationship between commodity and equity valuations. The ratio of the GSCI Commodity Index to the S&P 500 Index is a useful benchmark for assessing market sentiment and economic conditions. Additionally, monitoring global economic indicators, such as inflation rates, GDP growth, and industrial production, can provide valuable insights into commodity demand and equity performance.
Diversifying Portfolios
Diversification remains a cornerstone of sound investment strategies. Investors should consider allocating a portion of their portfolios to commodities as a hedge against inflation and market volatility. Commodities can offer significant returns during periods of economic uncertainty and market turbulence. A diversified portfolio that includes a mix of equities and commodities can help mitigate risks and enhance long-term performance.
Understanding Market Cycles
Commodity markets often follow long-term cycles, driven by factors such as supply and demand dynamics, technological advancements, and geopolitical events. Understanding these cycles can help investors identify opportunities and manage risks. For example, periods of low commodity valuations relative to equities have historically signaled the beginning of new commodity supercycles, providing potential for significant returns.
Important Takeaways
-
Historical Context: Key events like the 1973-1974 Oil Embargo, the 1971 dollar-suspension, the 2000 dot-com bubble, the 2008 financial crisis, and the 2020 COVID-19 pandemic have significantly impacted the relationship between commodity and equity valuations. Understanding these events can provide valuable insights into current market dynamics.
-
Monitoring Indicators: Keeping an eye on key indicators, such as the GSCI Commodity Index to S&P 500 Index ratio, can help investors navigate market trends and make informed decisions.
-
Diversification: Allocating a portion of your portfolio to commodities can offer a hedge against inflation and market volatility, enhancing long-term performance.
-
Market Cycles: Understanding long-term commodity cycles can help investors identify opportunities and manage risks. Periods of low commodity valuations relative to equities have historically signaled the beginning of new commodity supercycles.
Conclusion
The relationship between commodity and equity valuations is a complex and dynamic area of financial analysis. By understanding historical context, monitoring key indicators, and diversifying portfolios, investors can navigate market trends and make informed decisions. As we move forward, keeping an eye on global economic indicators and market cycles will be crucial for identifying opportunities and managing risks in the ever-changing landscape of commodity and equity markets.
Watch the Reel
Questions readers ask
What does the S&P 500 commodity ratio represent and why is it important?
The S&P 500 commodity ratio is the comparison of the prices of commodities to the S&P 500 index. It is important because it helps investors understand the relative performance and risk of tangible assets, like gold and oil, compared to company ownership. This ratio is a crucial metric for identifying trends in the commodity and equity markets.
How have commodity prices compared to equity valuations over the past 50 years?
Over the past 50 years, commodity prices have significantly decreased relative to equity valuations, reaching a 50-year low. This shift is notable, as similar lows in the past have marked the beginning of new commodity supercycles, which are extended periods of rising commodity prices.
What was the impact of the 1973 oil embargo on the commodity to equity ratio?
The 1973 oil embargo caused a dramatic increase in oil prices, which in turn led to a significant change in the commodity to equity ratio. This event marked a historical shift in the market, causing the ratio to rise as commodity prices surged and equity markets were affected by the economic uncertainty of the time.
Why might investors be interested in the historical perspective of commodity and equity markets over the past 50 years?
Investors are interested in this historical perspective to gain insights into market trends and to refine their investment strategies. By analyzing the performance of both commodity and equity markets over time, investors can anticipate future market shifts and make more informed decisions about where to allocate their resources.
What are some examples of commodities and why are they important to investors?
Examples of commodities include gold, oil, and agricultural products. These tangible assets are important to investors as they can serve as hedges against inflation and economic uncertainty. Monitoring the prices of these commodities can provide investors with a better understanding of broader market trends and risk management strategies.
How can understanding the relationship between commodities and equities help in investment strategies?
Understanding this relationship can help investors diversify their portfolios by balancing tangible assets and ownership in companies. It also helps in anticipating market trends, such as the potential for a new commodity supercycle, which can impact both commodity and equity markets. By analyzing this relationship, investors can better manage risk and optimize returns.
Recent articles
Fresh deep dives from the latest Reels we unpacked.




Comments
Be the first to comment.