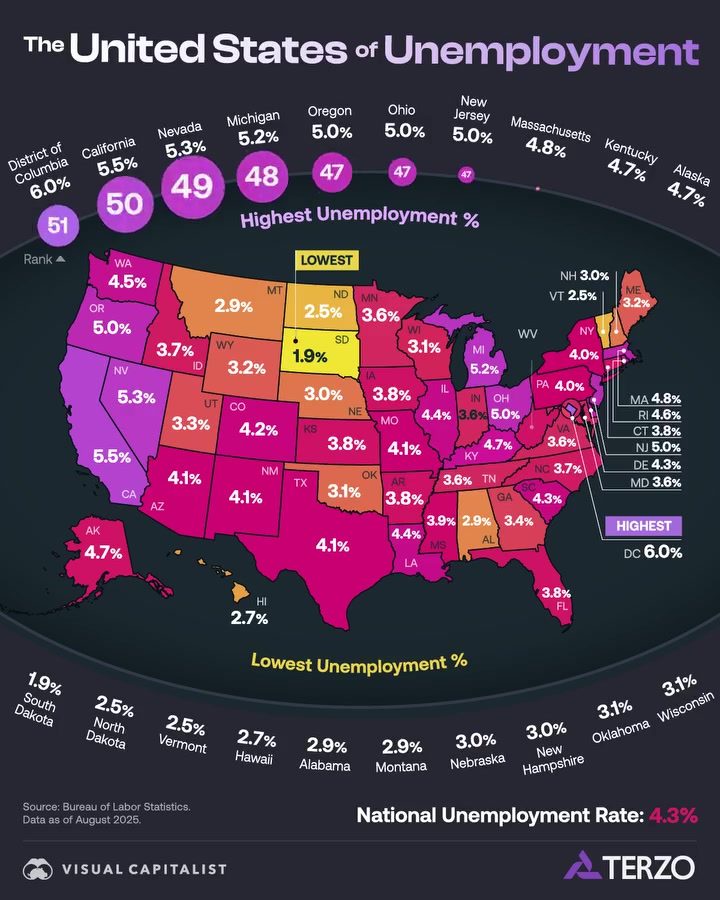
Unemployment Rates Across the United States in August 2025
The U.S. unemployment rate in August 2025 stood at 4.3%. This figure reflects the average across all 50 states and the District of Columbia. However, the national average doesn't tell the whole story. There are significant variations in unemployment rates from one state to another. Let's dive into the details to understand how these rates fluctuate and what factors might be influencing these differences.
Why This Matters
Understanding regional unemployment rates is crucial for several reasons. It helps policymakers tailor economic strategies, informs job seekers about the best opportunities, and provides businesses with insights into labor market conditions. Whether you're an economist, a job seeker, or an entrepreneur, knowing where unemployment is high or low can offer valuable insights.
Main Discussion
National Overview
As of August 2025, the national unemployment rate is 4.3%. This figure is a midpoint in the range of unemployment rates seen across the states. The Bureau of Labor Statistics provides the data that allows for a detailed breakdown of unemployment by state.
Regional Variations
Highest Unemployment Rates
Several states and the District of Columbia have unemployment rates significantly higher than the national average. Here are the states with the highest unemployment rates:
- District of Columbia leads with 6.0%.
- California follows closely with 5.5%.
- Nevada is at 5.3%.
- Oregon and New Jersey both stand at 5.0%.
- Wyoming has a rate of 4.5%.
These higher rates could be influenced by various factors, including economic downturns, reduced industry demand, or seasonal fluctuations.
Lowest Unemployment Rates
Conversely, some states boast much lower unemployment rates, indicating strong job markets and robust economies:
- North Dakota and South Dakota share the lowest rate at 1.9%.
- Vermont has 2.5%.
- Maine and New Hampshire both have 3.0%.
- Connecticut and Alabama each have 3.2%.
These states likely benefit from diverse economic activities, including strong sectors like technology, healthcare, and manufacturing.
Mid-Range States
Many states fall within a mid-range of unemployment rates, offering a mix of opportunities and challenges:
- Alaska, Kentucky, and Massachusetts all have unemployment rates around 4.7% to 4.8%.
- Michigan and Illinois have unemployment rates at 5.2%.
- Ohio and West Virginia hover around 5.0% to 5.2%.
- South Carolina, Tennessee, and Maryland have rates around 3.6% to 4.3%.
- Georgia and Pennsylvania each have 4.0% to 4.3%.
These states reflect a variety of economic conditions, with some experiencing moderate growth and others facing more significant challenges.
Practical Tips
For Job Seekers
If you're looking for job opportunities, consider targeting states with lower unemployment rates. These areas may offer more job openings and potentially higher wages. States with the lowest unemployment rates, such as North Dakota, South Dakota, and Vermont, often have robust economies and diverse job markets.
For Employers
Businesses aiming to expand or relocate should evaluate states with lower unemployment rates as potential locations. This could mean a more stable workforce and possibly lower recruitment costs. However, it's essential to consider other factors like cost of living, local regulations, and industry-specific conditions.
Important Takeaways
- Variability Across States: The unemployment rate varies significantly from one state to another, reflecting diverse economic conditions.
- National Average: The national unemployment rate of 4.3% is the midpoint, with states falling both above and below this figure.
- Economic Indicators: Higher unemployment rates in some states could indicate economic challenges, while lower rates often signal robust job markets and economic growth.
Conclusion
Understanding the unemployment rates across the United States provides valuable insights into the regional economic landscape. Whether you're looking for a job, planning to start a business, or simply interested in economic trends, knowing where the job opportunities are can be a game-changer. By examining the data from the Bureau of Labor Statistics, we gain a clearer picture of which states are thriving and which might need additional economic support.
Watch the Reel
Questions readers ask
What was the average unemployment rate in the US for August 2025?
The average unemployment rate in the US for August 2025 was 4.3%. This figure includes all 50 states and the District of Columbia.
Which states had the lowest and highest unemployment rates in August 2025?
In August 2025, the lowest unemployment rate was 1.9% and the highest was 6.0%. Unfortunately, without the data from individual states, it is impossible to specify which states had the lowest and highest rates.
How can I find the unemployment rate for a specific state in August 2025?
The specific unemployment rates for each state in August 2025 can be found on the Bureau of Labor Statistics website. They provide detailed reports that break down the unemployment rates by state, allowing for a comprehensive view of the labor market across the country.
Why do unemployment rates vary so much between states?
Unemployment rates can vary between states due to factors such as local economic conditions, industry composition, and regional job market dynamics. For example, states with a strong presence in growing industries may have lower unemployment rates, while those experiencing economic downturns or relying heavily on declining industries might see higher rates.
What can policymakers do with state-specific unemployment data?
Policymakers can use state-specific unemployment data to tailor economic strategies, such as targeted job training programs, infrastructure investments, and tax incentives, to address local labor market needs. This data helps in making informed decisions to support economic growth and reduce unemployment in specific regions.
How often is the unemployment rate updated by the Bureau of Labor Statistics?
The Bureau of Labor Statistics typically updates the unemployment rate on a monthly basis. This frequent reporting allows for timely insights into the labor market, providing a clear picture of how employment conditions are evolving across the country.
What are the best resources for tracking unemployment rates by state?
The Bureau of Labor Statistics (BLS) is the primary resource for tracking unemployment rates by state. Their monthly reports provide detailed statistics and analyses, including state-by-state unemployment rates, which can be accessed on their official website. Additionally, various news outlets and economic research organizations often summarize and analyze this data, offering different perspectives on the labor market trends.
Recent articles
Fresh deep dives from the latest Reels we unpacked.




Comments
Be the first to comment.