Wealth Distribution in America
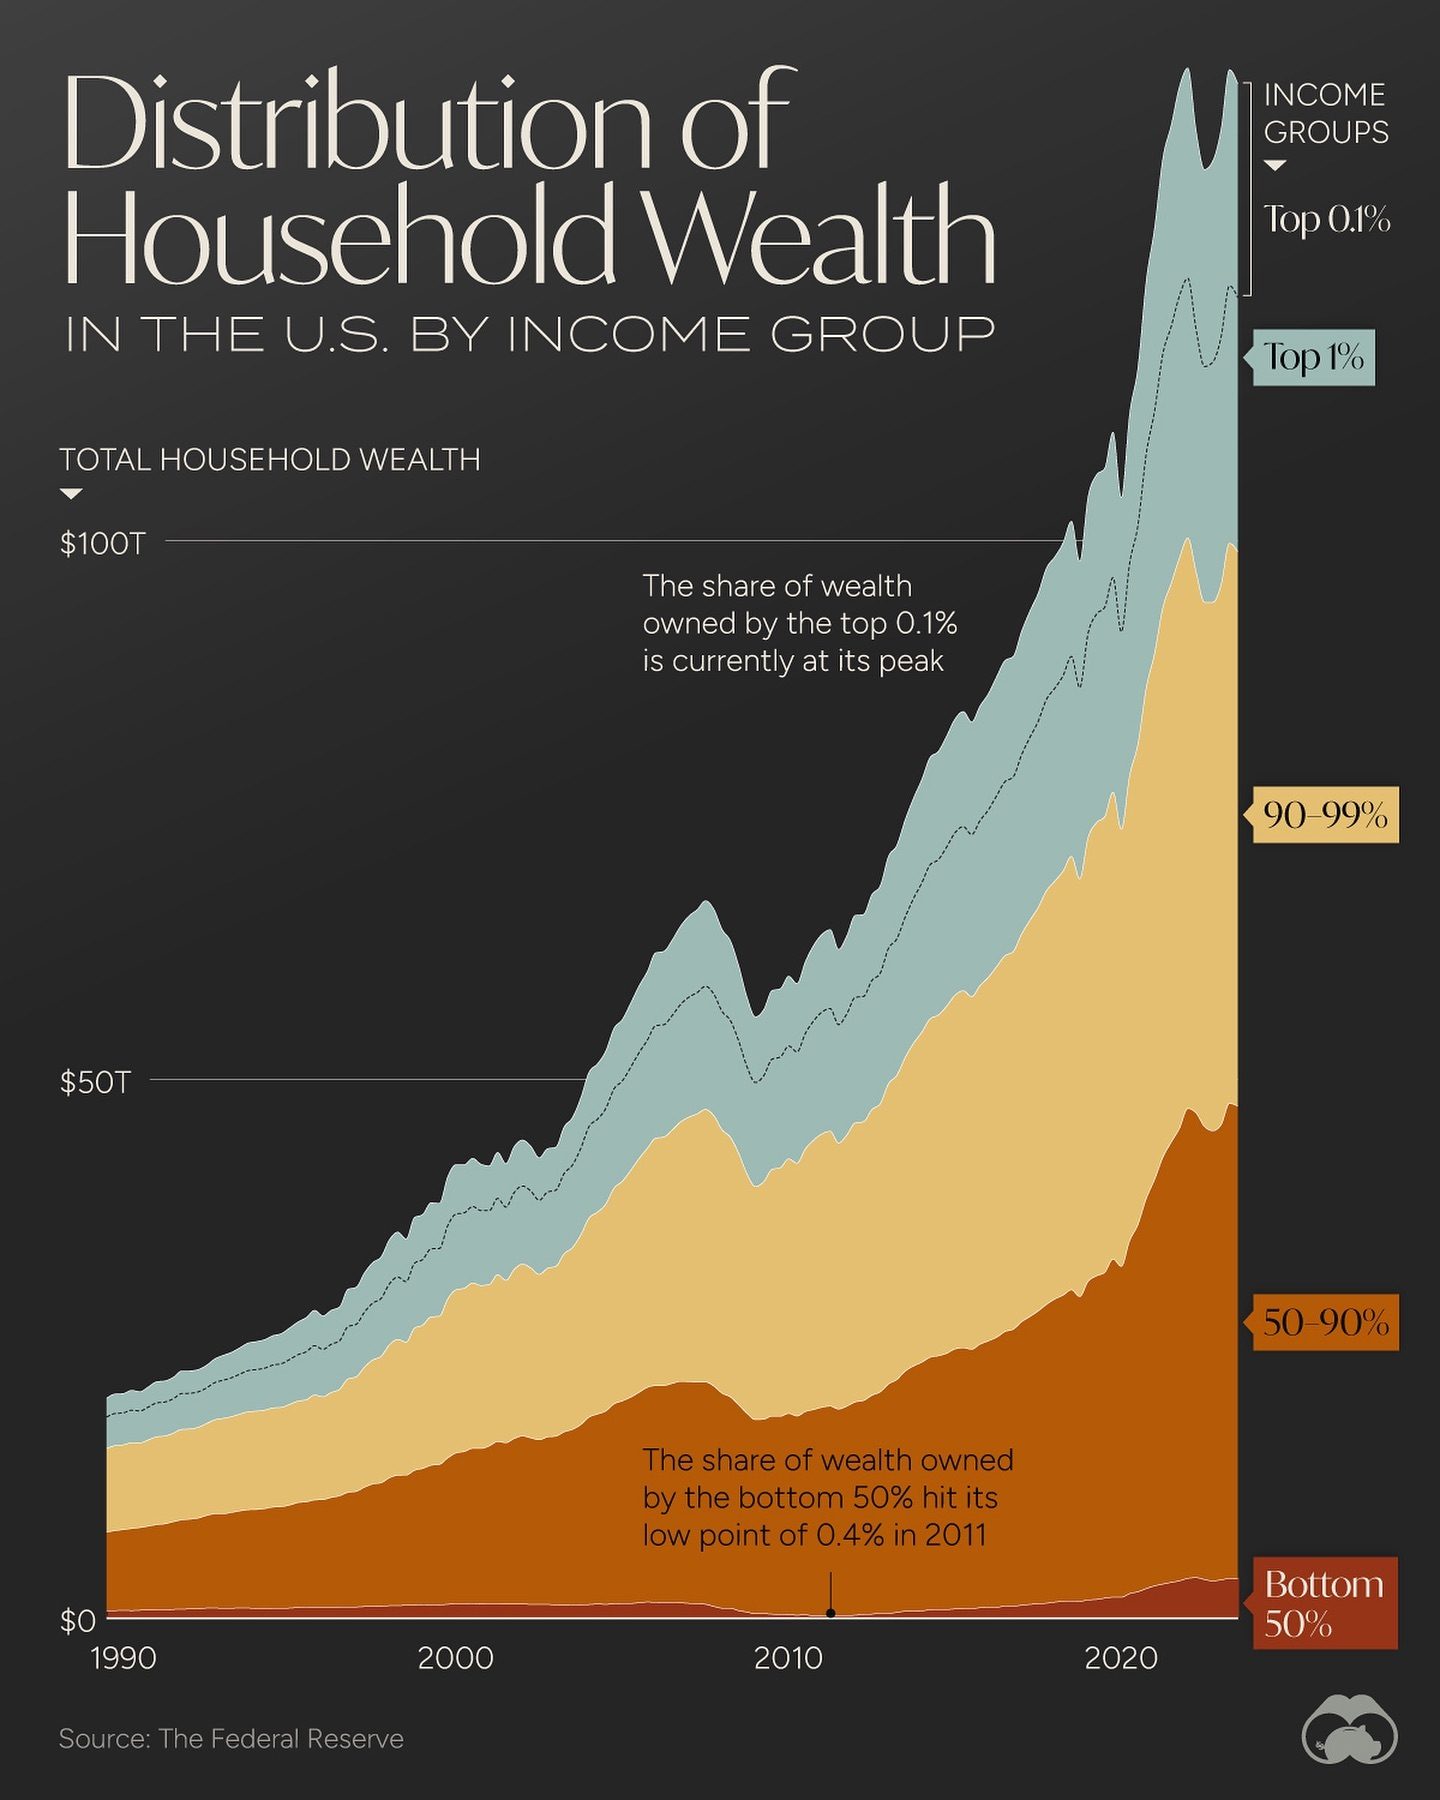
Wealth distribution in America has evolved significantly since 1990, with a notable concentration of wealth at the top. As of recent data, the richest 0.1% of households hold a peak share of the nation's wealth, with each household in this elite bracket possessing a minimum of $38 million. This group comprises roughly 131,000 households. The infographic below delves into these dynamics, illustrating the distribution of household wealth in the U.S. over time.
Why This Matters
Understanding wealth distribution is crucial for grasping the economic landscape of the country. It impacts policies, societal structures, and economic opportunities. The Federal Reserve data, which underpins the infographic, provides a clear picture of how wealth has shifted among different income groups from 1990 to 2020.
Main Discussion
Historical Trends
The infographic highlights several key trends:
- Top 0.1% Wealth Share: The top 0.1% currently holds the highest share of wealth on record. This group's wealth has grown substantially, reflecting a broader trend of wealth concentration at the top.
- Bottom 50% Low Point: In 2011, the bottom 50% of households reached a low point, owning only 0.4% of the total household wealth. This stark contrast illustrates the widening wealth gap.
Income Groups and Wealth Share
The data is segmented by income groups, providing a detailed look at how wealth is distributed:
- Top 1%: This group holds a significant portion of the wealth, indicating that a small percentage of the population controls a large share of the nation's resources.
- Bottom 50%: Despite representing half of the population, the bottom 50% owns a minimal share of the total wealth, highlighting the disparities in the wealth distribution landscape.
- Middle Income Groups (50-90%): These groups show varying levels of wealth ownership, with the 90-99% bracket holding a more substantial share compared to the lower 50%.
Federal Reserve Data
The infographic is based on data from the Federal Reserve, a reliable source for economic indicators. This data provides a comprehensive view of wealth distribution, from the bottom 50% to the top 1%, and helps in understanding the broader economic trends.
The Federal Reserve's data is essential for several reasons:
- Reliability: As a government entity, the Federal Reserve's data is considered reliable and unbiased.
- Comprehensive Coverage: The data spans from 1990 to 2020, providing a long-term perspective on wealth distribution.
- Detail: The data breaks down wealth distribution by income groups, offering granular insights into how wealth is concentrated.
Practical Tips
When analyzing wealth distribution, consider the following:
Understanding the Data
- Look at Trends Over Time: Wealth distribution changes over time, and understanding these trends can provide valuable insights. For example, the infographic shows how the top 0.1% has increased its wealth share over the decades.
- Compare Different Groups: Comparing wealth shares across different income groups can highlight disparities and trends. For instance, the bottom 50% hit a low point in 2011, while the top 0.1% reached a peak.
Contextualizing the Information
- Economic Indicators: Wealth distribution is just one indicator of the broader economic landscape. Consider other factors such as income inequality, employment rates, and GDP growth.
- Policy Implications: Understanding wealth distribution can inform policy decisions aimed at addressing income inequality and promoting economic growth.
Important Takeaways
The infographic offers several key insights:
- Wealth Concentration: There is a significant concentration of wealth at the top, with the richest 0.1% holding a peak share of the nation's wealth.
- Bottom 50% Struggles: The bottom 50% has faced significant challenges in owning a larger share of the wealth, hitting a low point in 2011.
- Data Reliability: The Federal Reserve data provides a reliable and comprehensive view of wealth distribution in the U.S.
Conclusion
The wealth distribution in America has seen a notable concentration at the top, with the richest 0.1% holding a peak share of the nation's wealth. The infographic, based on Federal Reserve data, offers a clear view of this trend, showing how wealth has shifted among different income groups from 1990 to 2020. Understanding these dynamics is crucial for grasping the broader economic landscape and making informed policy decisions.
Watch the Reel
Questions readers ask
What exactly does the top 0.1% wealth mean and who are they?
The top 0.1% wealth refers to the wealthiest 0.1% of households in the United States. As of recent data, this group consists of approximately 131,000 families, each with a minimum wealth of $38 million. These households hold a record-high share of the nation’s wealth, indicating a significant concentration of wealth at the top.
How has wealth distribution in the US changed since 1990?
Since 1990, wealth distribution in America has shifted significantly, with a notable increase in wealth concentration at the top. In 2023, the top 0.1% of households hold a larger share of the nation's wealth than ever before, indicating a widening wealth gap. This trend highlights a growing disparity between the wealthiest Americans and the rest of the population.
What is the current wealth share of the bottom 50% of the population?
As of recent data, the bottom 50% of the population in the United States owns only 0.4% of the total household wealth. This figure underscores the vast disparity in wealth distribution, with the majority of wealth concentrated at the very top of the wealth spectrum.
What impact does wealth distribution have on societal structures and economic opportunities?
Wealth distribution significantly influences societal structures and economic opportunities. A concentrated wealth distribution can lead to disparities in access to resources, opportunities, and influence, affecting everything from housing and healthcare to employment and political representation. Understanding these dynamics is crucial for policymaking and addressing economic inequalities.
How does the wealth share of the top 0.1% compare to the bottom 50%?
The wealth share of the top 0.1% is vastly higher than that of the bottom 50%. The top 0.1% holds a record-high share of the nation's wealth, with each household possessing at least $38 million. In contrast, the bottom 50% of the population owns a mere 0.4% of total household wealth, highlighting a profound wealth disparity.
What do the Federal Reserve data reveal about wealth distribution in the USA?
The Federal Reserve data show that wealth distribution in the USA has become increasingly unequal. The data reveal a significant concentration of wealth at the top, with the richest 0.1% of households holding a larger share of the nation’s wealth than ever before. Additionally, the data illustrate how wealth distribution has evolved over time, providing a clear picture of the growing wealth inequality.
Recent articles
Fresh deep dives from the latest Reels we unpacked.




Comments
Be the first to comment.